Terpenes (/ˈtɜːrpiːn/) are a large and diverse class of organic compounds, produced by a variety of plants, particularly conifers,[1] though also by some insects such as termites or swallowtail butterflies, which emit terpenes from their osmeteria. They often have a strong odor. They may protect the plants that produce them by deterring herbivores and by attracting predators and parasites of herbivores.[2] Many terpenes are aromatic hydrocarbons and thus may have had a protective function.[3] The difference between terpenes and terpenoids is that terpenes are hydrocarbons, whereas terpenoids contain additional functional groups.
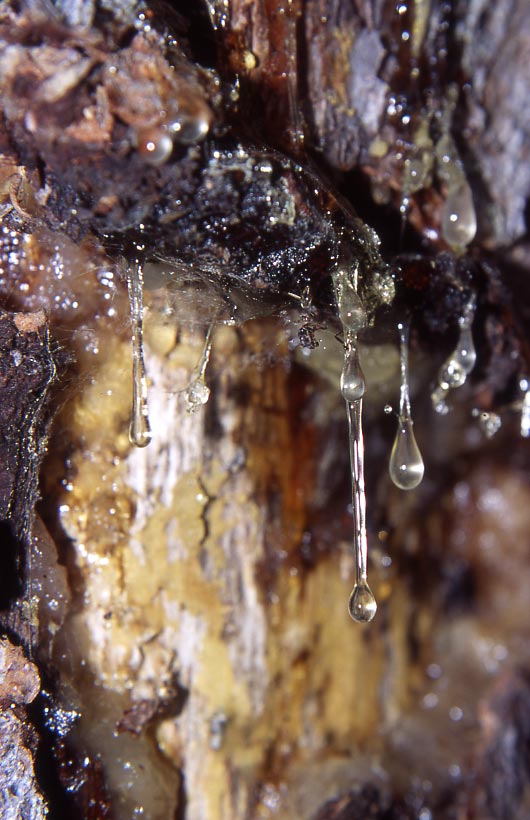
They are the major components of resin, and of turpentine produced from resin. The name “terpene” is derived from the word “turpentine“. In addition to their roles as end-products in many organisms, terpenes are major biosynthetic building blocks within nearly every living creature. Steroids, for example, are derivatives of the triterpene squalene.
When terpenes are modified chemically, such as by oxidation or rearrangement of the carbon skeleton, the resulting compounds are generally referred to as terpenoids. Some authors will use the term terpene to include all terpenoids. Terpenoids are also known as isoprenoids.
Terpenes and terpenoids are the primary constituents of the essential oils of many types of plants and flowers. Essential oils are used widely as fragrances in perfumery, and in medicine and alternative medicines such as aromatherapy. Synthetic variations and derivatives of natural terpenes and terpenoids also greatly expand the variety of aromas used in perfumery and flavors used in food additives. Vitamin A is a terpene.
Terpenes are released by trees more actively in warmer weather, acting as a natural form of cloud seeding. The clouds reflect sunlight, allowing the forest to regulate its temperature.[4]
The aroma and flavor of hops, highly desirable in some beers, comes from terpenes. Of the terpenes in hops myrcene, β-pinene, β-caryophyllene, and α-humulene are found in the largest quantities.[5]
Terpenes are also major constituents of Cannabis sativa plants, which contain at least 120 identified compounds.[6] In addition to being responsible for the plant’s aroma, they can act synergistically with cannabinoids. In fact, there are several promising applications based on the combined use of cannabinoids and terpenes, such as new acne therapies utilizing CBD with the monoterpenes limonene, linalool, and pinene; new antiseptic agents with CBG and pinene; treatment of social anxiety disorder using CBD with limonene and linalool; and treatment of sleeping disorders by adding caryophyllene, linalool, and myrcene to 1:1 CBD/THC extracts.[6]
Structure and biosynthesis

Isoprene
Terpenes are derived biosynthetically from units of isoprene, which has the molecular formula C5H8. The basic molecular formulae of terpenes are multiples of that, (C5H8)n where n is the number of linked isoprene units. This is called the isoprene rule or the C5 rule. The isoprene units may be linked together “head to tail” to form linear chains or they may be arranged to form rings. One can consider the isoprene unit as one of nature’s common building blocks.
Isoprene itself does not undergo the building process, but rather activated forms, isopentenyl pyrophosphate (IPP or also isopentenyl diphosphate) and dimethylallyl pyrophosphate (DMAPP or also dimethylallyl diphosphate), are the components in the biosynthetic pathway. IPP is formed from acetyl-CoA via the intermediacy of mevalonic acid in the HMG-CoA reductase pathway. An alternative, totally unrelated biosynthesis pathway of IPP is known in some bacterial groups and the plastids of plants, the so-called MEP(2-Methyl-D-erythritol-4-phosphate)-pathway, which is initiated from C5-sugars. In both pathways, IPP is isomerized to DMAPP by the enzyme isopentenyl pyrophosphate isomerase.
|
Isopentenyl pyrophosphate |
Dimethylallyl pyrophosphate |


As chains of isoprene units are built up, the resulting terpenes are classified sequentially by size as hemiterpenes, monoterpenes, sesquiterpenes, diterpenes, sesterterpenes, triterpenes, and tetraterpenes. Essentially, they are all synthesised by terpene synthase.
Types

Second- or third-instar caterpillars of Papilio glaucus emit terpenes from their osmeterium.
Terpenes may be classified by the number of isoprene units in the molecule; a prefix in the name indicates the number of terpene units needed to assemble the molecule.
- Hemiterpenes consist of a single isoprene unit. Isoprene itself is considered the only hemiterpene, but oxygen-containing derivatives such as prenol and isovaleric acid are hemiterpenoids.
- Monoterpenes consist of two isoprene units and have the molecular formula C10H16. Examples of monoterpenes and monoterpenoids include geraniol, terpineol (present in lilacs), limonene (present in citrus fruits), myrcene (present in hops), linalool (present in lavender) or pinene (present in pine trees).[7] Iridoids derive from monoterpenes.
- Sesquiterpenes consist of three isoprene units and have the molecular formula C15H24. Examples of sesquiterpenes and sesquiterpenoids include humulene, farnesenes, farnesol. (The sesqui- prefix means one and a half.)
- Diterpenes are composed of four isoprene units and have the molecular formula C20H32. They derive from geranylgeranyl pyrophosphate. Examples of diterpenes and diterpenoids are cafestol, kahweol, cembrene and taxadiene (precursor of taxol). Diterpenes also form the basis for biologically important compounds such as retinol, retinal, and phytol.
- Sesterterpenes, terpenes having 25 carbons and five isoprene units, are rare relative to the other sizes. (The sester- prefix means half to three, i.e. two and a half.) An example of a sesterterpenoid is geranylfarnesol.
- Triterpenes consist of six isoprene units and have the molecular formula C30H48. The linear triterpene squalene, the major constituent of shark liver oil, is derived from the reductive coupling of two molecules of farnesyl pyrophosphate. Squalene is then processed biosynthetically to generate either lanosterol or cycloartenol, the structural precursors to all the steroids.
- Sesquarterpenes are composed of seven isoprene units and have the molecular formula C35H56. Sesquarterpenes are typically microbial in their origin. Examples of sesquarterpenoids are ferrugicadiol and tetraprenylcurcumene.
- Tetraterpenes contain eight isoprene units and have the molecular formula C40H64. Biologically important tetraterpenoids include the acyclic lycopene, the monocyclic gamma-carotene, and the bicyclic alpha- and beta-carotenes.
- Polyterpenes consist of long chains of many isoprene units. Natural rubber consists of polyisoprene in which the double bonds are cis. Some plants produce a polyisoprene with trans double bonds, known as gutta-percha.
- Norisoprenoids, such as the C13-norisoprenoids 3-oxo-α-ionol present in Muscat of Alexandria leaves and 7,8-dihydroionone derivatives, such as megastigmane-3,9-diol and 3-oxo-7,8-dihydro-α-ionol found in Shiraz leaves (both grapes in the species Vitis vinifera)[8] or wine[9][10] (responsible for some of the spice notes in Chardonnay), can be produced by fungal peroxidases[11] or glycosidases.[12]
Research
A range of terpenes have been identified as high-value chemicals in food, cosmetic, pharmaceutical and biotechnology industries.[13][14] Chemical synthesis of terpenes can be problematic because of their complex structure, and plants produce very small amounts of these valuable chemicals, making it difficult, time-consuming and expensive to extract them directly from plants. Scientists are working to identify the key enzymes and pathways that produce terpenes in plants. In 2014, researchers at the John Innes Centre[15] searched the genomes of 17 plant species to find the genes that encode terpenoid synthase enzymes that give terpenes their basic structure, and cytochrome P450s that modify this basic structure.[16] Once genes have been identified for the synthesis pathway of a specific terpene, synthetic biology techniques could be used to make high levels of this terpene, using plants or microorganisms (e.g. yeast) as “factories”. This could mean cheaper and more sustainable production of economically and medicinally important terpenes. For example, a precursor to the terpene artemisinin, originally sourced from the plant Artemisia annua, can now be produced in yeast.[17]
Other uses
Research into terpenes has found that many of them possess qualities that make them useful active ingredients as part of natural agricultural pesticides.[18]
Terpin hydrate is a derivative of turpentine. An expectorant and humectant, it is commonly used in the treatment of acute or chronic bronchitis and related conditions.
Terpenes are used by termites of the Nasutitermitinae family to attack enemy insects, through the use of a specialized mechanism called a fontanellar gun.[19]
References
- ^ Merriam-Webster Online Dictionary
- ^ Martin, Diane M.; Gershenzon, Jonathan; Bohlmann, Jörg (July 2003). “Induction of Volatile Terpene Biosynthesis and Diurnal Emission by Methyl Jasmonate in Foliage of Norway Spruce”. Plant Physiology. 132 (3): 1586–1599. doi:10.1104/pp.103.021196. Retrieved 1 November 2014.
- ^ Pichersky, E. (10 February 2006). “Biosynthesis of Plant Volatiles: Nature’s Diversity and Ingenuity”. Science. 311 (5762): 808–811. doi:10.1126/science.1118510.
- ^ Adam, David (October 31, 2008). “Scientists discover cloud-thickening chemicals in trees that could offer a new weapon in the fight against global warming”. The Guardian.
- ^ Glenn Tinseth, “Hop Aroma and Flavor”, January/February 1993, Brewing Techniques. <http://realbeer.com/hops/aroma.html> Accessed July 21, 2010.
- ^ a b Aizpurua-Olaizola, Oier; Soydaner, Umut; Öztürk, Ekin; Schibano, Daniele; Simsir, Yilmaz; Navarro, Patricia; Etxebarria, Nestor; Usobiaga, Aresatz (2016-02-26). “Evolution of the Cannabinoid and Terpene Content during the Growth of Cannabis sativa Plants from Different Chemotypes”. Journal of Natural Products. 79 (2): 324–331. doi:10.1021/acs.jnatprod.5b00949. ISSN 0163-3864.
- ^ Alchimia Blog, Marijuana terpenes and their effects
- ^ Günata, Ziya; Wirth, Jérémie L.; Guo, Wenfei; Baumes, Raymond L. (2001). “Carotenoid-Derived Aroma Compounds”. ACS Symposium Series. ACS Symposium Series. 802: 255–261. doi:10.1021/bk-2002-0802.ch018. ISBN 0-8412-3729-8.
|chapter=ignored (help), ACS Symposium Series, Vol. 802 - ^ Winterhalter, P.; Sefton, M. A.; Williams, P. J. (1990). “Volatile C13-Norisoprenoid Compounds in Riesling Wine Are Generated From Multiple Precursors”. Am. J. Enol. Vitic. 41 (4): 277–283.
- ^ Vinholes, Juliana; Coimbra, Manuel A.; Rocha, Sílvia M. (2009). “Rapid tool for assessment of C13 norisoprenoids in wines”. Journal of Chromatography A. 1216 (47): 8398–403. doi:10.1016/j.chroma.2009.09.061. PMID 19828152.
- ^ Zelena, Kateryna; Hardebusch, Björn; HüLsdau, BäRbel; Berger, Ralf G.; Zorn, Holger (2009). “Generation of Norisoprenoid Flavors from Carotenoids by Fungal Peroxidases”. Journal of Agricultural and Food Chemistry. 57 (21): 9951–5. doi:10.1021/jf901438m. PMID 19817422.
- ^ Cabaroglu, Turgut; Selli, Serkan; Canbas, Ahmet; Lepoutre, Jean-Paul; Günata, Ziya (2003). “Wine flavor enhancement through the use of exogenous fungal glycosidases”. Enzyme and Microbial Technology. 33 (5): 581–587. doi:10.1016/S0141-0229(03)00179-0.
- ^ Thimmappa, R.; Geisler, K.; Louveau, T.; O’Maille, P.; Osbourn, A. (2014). “Triterpene biosynthesis in plants”. Annu Rev Plant Biol. 65: 225–57. doi:10.1146/annurev-arplant-050312-120229. PMID 24498976. Retrieved 19 January 2015.
- ^ Augustin, J.M.; Kuzina, V.; Andersen, S.B.; Bak, S. (2011). “Molecular activities, biosynthesis and evolution of triterpenoid saponins”. Phytochemistry. 72: 435–57. doi:10.1016/j.phytochem.2011.01.015. Retrieved 19 January 2015.
- ^ “John Innes Centre”. Retrieved 19 January 2015.
- ^ Boutanaev, A.M.; Moses, T.; Zi, J.; Nelson, D.R.; Mugford, S.T.; Peters, R.J.; Osbourn, A. (2015). “Investigation of terpene diversification across multiple sequenced plant genomes”. Proc Natl Acad Sci USA. 112 (1): E81–8. doi:10.1073/pnas.1419547112. PMC 4291660
 . PMID 25502595.
 - ^ Paddon, C.J.; Keasling, J.D. (2014). “Semi-synthetic artemisinin: a model for the use of synthetic biology in pharmaceutical development”. Nat Rev Microbiol. 12 (5): 355–67. doi:10.1038/nrmicro3240. Retrieved 19 January 2015.
- ^ Isman, MB (2000). “Plant essential oils for pest and disease management”. Crop Protection. 19: 603–608. doi:10.1016/S0261-2194(00)00079-X. Retrieved 18 September 2014.
- ^ W. L. Nutting; M. S. Blum & H. M. Fales. (1974). “Behavior of the North American Termite, Tenuirostritermes tenuirostris, with Special Reference to the Soldier Frontal Gland Secretion, Its Chemical Composition, and Use in Defense”. Psyche. Hindawi Publishing Corporation. 81 (1): 167–177. doi:10.1155/1974/13854. Retrieved July 22, 2011.
External links
- Institute of Chemistry – terpenes
- Structures of alpha pinene and beta pinene
- Terpenes at the US National Library of Medicine Medical Subject Headings (MeSH)