Based on the information provided in the attached scientific article, here is a detailed description of Cannabis indica:
Origin and Classification
Cannabis indica was first described by Jean-Baptiste Lamarck in 1785 as a distinct species from Cannabis sativa . Lamarck characterized C. indica as a wild species growing in India and neighboring countries, in contrast to C. sativa which was widely cultivated in Western continents.
Taxonomic Debate
The classification of C. indica as a separate species has been debated for centuries:
– Linnaeus originally described only one species, C. sativa, in 1753
– Lamarck proposed C. indica as a second species in 1785
– In the 19th century, some botanists rejected C. indica and considered Cannabis a monotypic genus
– More recently, some researchers have suggested reinstating C. indica as a distinct species
Morphological Characteristics
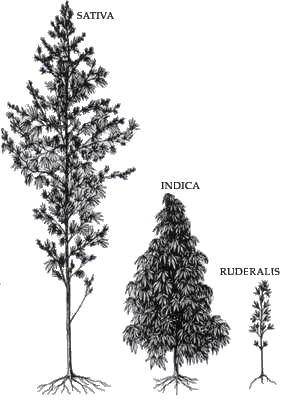
While not explicitly described in the article, C. indica is generally known to have the following traits compared to C. sativa:
– Shorter, bushier plants
– Broader leaves with wider leaflets
– Denser branch structure
– Shorter flowering cycles
Chemical Profile
C. indica is associated with higher levels of intoxicating compounds:
– Higher THC (tetrahydrocannabinol) content
– Often contains both THC and CBD (cannabidiol)
– Belongs to the “high cannabinoid” group of narcotic plants domesticated in South/Central Asia
Modern Classification Approaches
Recent taxonomic treatments have taken different approaches to C. indica:
1. Small & Cronquist (1976) classified it as:
Cannabis sativa L. subsp. indica Small & Cronquist var. indica (Lam) Wehmer
2. Small (2015) proposed classifying domesticated Cannabis into groups, with C. indica falling under:
“Group of the narcotic plants domesticated in South Asia (Afghanistan and neighboring Countries), contains both THC and CBD.”
Hybridization
The article notes that all Cannabis varieties can successfully interbreed and produce fertile hybrids. This has led to numerous hybrid strains with characteristics intermediate between traditional C. sativa and C. indica types.
Modern Usage and Nomenclature
Many cannabis strains marketed as “indica” may not have a clear taxonomic basis. The article suggests avoiding the sativa/indica distinction for cultivated varieties, instead using:
– Formal cultivar names for properly registered varieties (e.g. Cannabis ‘Fibranova’)
– “Cannabis strain” followed by the popularized name for informal varieties (e.g. Cannabis strain Granddaddy Purple)
In conclusion, while C. indica has historical significance in cannabis taxonomy, its status as a distinct species remains debated. Modern cannabis breeding has blurred the lines between traditional sativa and indica types, making clear distinctions challenging from both a botanical and practical perspective.
Citations: