
Size of this PNG preview of this SVG file: 800 × 390 pixels. Other resolutions: 320 × 156 pixels | 640 × 312 pixels | 1,024 × 500 pixels | 1,280 × 625 pixels | 2,560 × 1,250 pixels | 840 × 410 pixels.
Original file (SVG file, nominally 840 × 410 pixels, file size: 40 KB)
Summary
| Description |
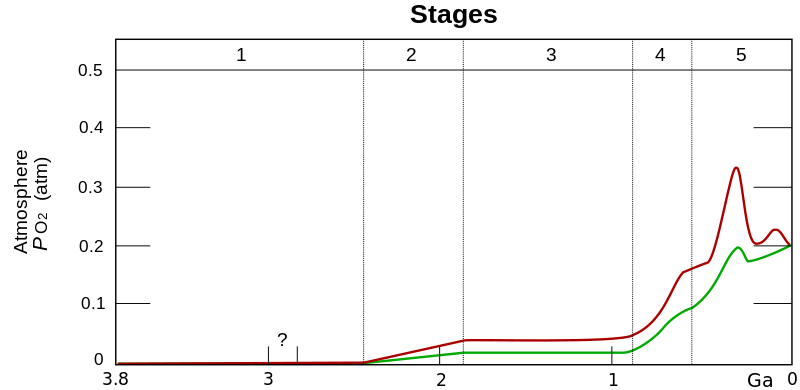
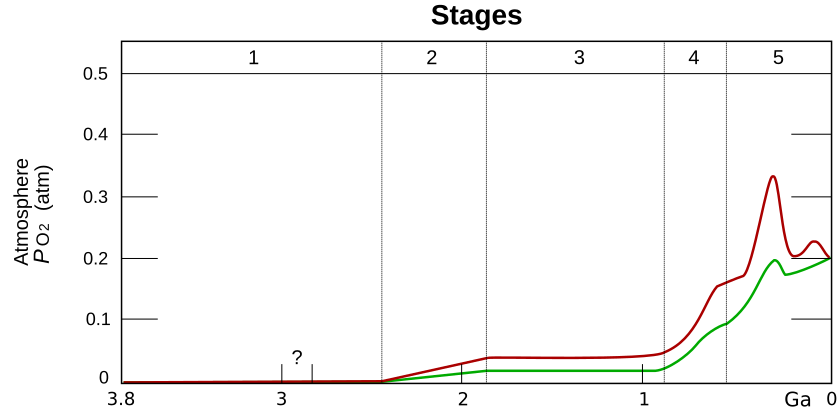
English: Estimated evolution of atmospheric . The upper red and lower green lines represent the range of the estimates. The stages are: stage 1 (3.85–2.45Gyr ago (Ga)), stage 2 (2.45–1.85Ga), stage 3 (1.85–0.85Ga), Stage 4 (0.85–0.54Ga )and stage 5 (0.54Ga–present) . |
| Date | (UTC) |
| Source | |
| Author |
|
| Other versions |
[]
.png:
.jpg:
|


| This is a retouched picture, which means that it has been digitally altered from its original version. Modifications: Time scale. The original can be viewed here: Oxygenation-atm.svg:
|
Licensing
I, the copyright holder of this work, hereby publish it under the following licenses:
| This file is licensed under the Creative Commons Attribution-Share Alike 3.0 Unported license. | ||
| ||
| This licensing tag was added to this file as part of the GFDL licensing update. |

|
Permission is granted to copy, distribute and/or modify this document under the terms of the GNU Free Documentation License, Version 1.2 or any later version published by the Free Software Foundation; with no Invariant Sections, no Front-Cover Texts, and no Back-Cover Texts. A copy of the license is included in the section entitled GNU Free Documentation License. |
You may select the license of your choice.
Original upload log
This image is a derivative work of the following images:
- File:Oxygenation-atm.svg licensed with Cc-by-sa-3.0-migrated, GFDL
- 2009-01-02T05:19:53Z TiCPU 840x410 (22026 Bytes) {{Information |Description={{en|1=Estimated evolution of atmospheric \ P_{{O_{{2}}}} and the concentration of O2 in the shallow and deep oceans. The stages are: stage 1 (3.85–2.45Gyr ago (Ga)), stage 2 (2.45–1.85Ga), stag
Uploaded with derivativeFX
File history
Click on a date/time to view the file as it appeared at that time.
| Date/Time | Thumbnail | Dimensions | User | Comment | |
|---|---|---|---|---|---|
| current | 13:07, 14 February 2024 | | 840 × 410 (40 KB) | Alfa-ketosav | File uploaded using svgtranslate tool (https://svgtranslate.toolforge.org/). Added translation for hu. |
| 19:22, 12 November 2022 |  | 840 × 410 (29 KB) | Hugo | File uploaded using svgtranslate tool (https://svgtranslate.toolforge.org/). Added translation for cs. | |
| 16:34, 22 January 2011 |  | 840 × 410 (24 KB) | Loudubewe | removing of false graph legend | |
| 16:13, 22 January 2011 |  | 840 × 410 (25 KB) | Loudubewe | {{Information |Description={{en|1=Estimated evolution of atmospheric <math> P_{{O_{{2}}}}</math> in the shallow (red line) and deep (green line) oceans. The stages are: stage 1 (3.85–2.45Gyr ago (Ga)), stage 2 (2.45–1.85Ga), stage 3 (1.85–0.85Ga), S |
File usage
The following pages on the English Wikipedia use this file (pages on other projects are not listed):
Global file usage
The following other wikis use this file:
- Usage on af.wikipedia.org
- Usage on ar.wikipedia.org
- Usage on az.wikipedia.org
- Usage on bn.wikipedia.org
- Usage on ca.wikipedia.org
- Usage on cs.wikipedia.org
- Usage on da.wikipedia.org
- Usage on de.wikipedia.org
- Usage on es.wikipedia.org
- Usage on et.wikipedia.org
- Usage on fr.wikipedia.org
- Usage on gl.wikipedia.org
- Usage on hu.wikipedia.org
- Usage on id.wikipedia.org
- Usage on ko.wikipedia.org
- Usage on nl.wikipedia.org
- Usage on pt.wikipedia.org
- Usage on simple.wikipedia.org
- Usage on si.wikipedia.org
- Usage on test.wikipedia.org
- Usage on te.wikipedia.org
- Usage on tl.wikipedia.org
- Usage on uk.wikipedia.org
- Usage on vi.wikipedia.org
- Usage on www.wikidata.org
- Usage on zh.wikipedia.org