Size of this preview: 514 × 600 pixels. Other resolutions: 206 × 240 pixels | 600 × 700 pixels.
Original file (600 × 700 pixels, file size: 71 KB, MIME type: image/png)
Summary[edit]
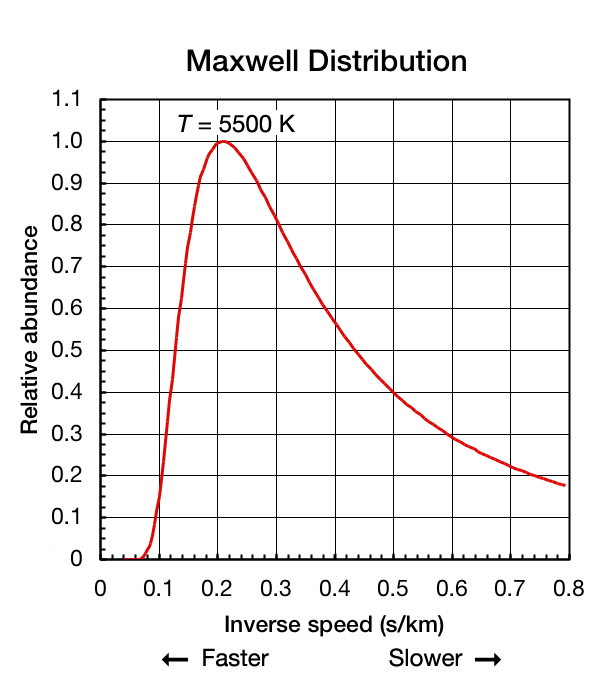
This graph shows the Maxwell distribution of helium atom speeds at 5500 kelvin. The speeds are shown as inverse speed so one can more easily compare this shape to that of a Planck curve. In this graph, the left end of the X-axis represents higher energies and higher speeds. Greg L 03:14, 4 August 2006 (UTC)
Licensing[edit]
History of Image:Maxwell Dist-Inverse Speed.jpg[edit]
- 2007-12-06T13:13:44Z Keenan Pepper (Talk | contribs) (406 bytes) ({{BadJPEG}})
- 2007-05-09T15:51:24Z Cydebot (Talk | contribs) (396 bytes) (Robot - Fixing GFDL tags project-wide per [[Wikipedia:GFDL standardization]].)
- 2006-08-04T05:16:08Z Greg L (Talk | contribs) (/* Summary */)
- 2006-08-04T03:14:03Z Greg L (Talk | contribs) (This graph shows the Maxwell distribution of helium atom speeds at 5500 kelvin. The speeds are shown as ''inverse'' speed so one can more easily compare the shape of the Planck curve, which has shorter wavelengths (higher energies and associated speeds))
File history
Click on a date/time to view the file as it appeared at that time.
| Date/Time | Thumbnail | Dimensions | User | Comment | |
|---|---|---|---|---|---|
| current | 02:10, 22 July 2008 | | 600 × 700 (71 KB) | 718 Bot (talk | contribs) | == Summary == This graph shows the Maxwell distribution of helium atom speeds at 5500 kelvin. The speeds are shown as ''inverse'' speed so one can more easily compare this shape to that of a Planck curve. In this graph, the left end of the X-axis represe |
You cannot overwrite this file.
File usage
The following pages on the English Wikipedia use this file (pages on other projects are not listed):