
Size of this preview: 800 × 495 pixels. Other resolutions: 320 × 198 pixels | 640 × 396 pixels | 1,024 × 634 pixels | 1,280 × 792 pixels | 2,560 × 1,585 pixels | 4,000 × 2,476 pixels.
Original file (4,000 × 2,476 pixels, file size: 6.04 MB, MIME type: image/png)
| Description |
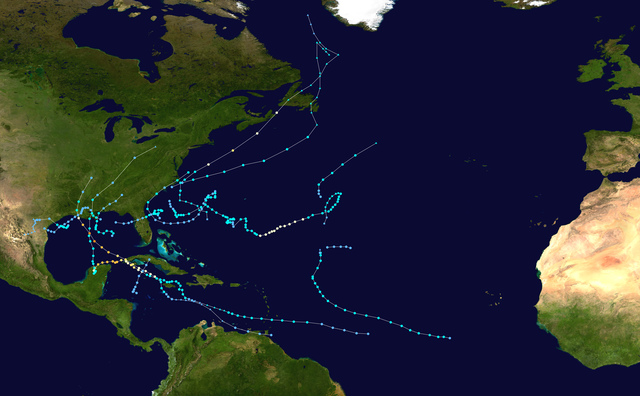
English: This map shows the tracks of all tropical cyclones in the 2002 Atlantic hurricane season. The points show the location of each storm at 6-hour intervals. The colour represents the storm's maximum sustained wind speeds as classified in the Saffir-Simpson Hurricane Scale (see below), and the shape of the data points represent the type of the storm.
Tropical depression (≤38 mph, ≤62 km/h)
Tropical storm (39–73 mph, 63–118 km/h)
Category 1 (74–95 mph, 119–153 km/h)
Category 2 (96–110 mph, 154–177 km/h)
Category 3 (111–129 mph, 178–208 km/h)
Category 4 (130–156 mph, 209–251 km/h)
Category 5 (≥157 mph, ≥252 km/h)
Unknown
Storm type |
| Source | Created using Wikipedia:WikiProject Tropical cyclones/Tracks. The background image is from NASA [1]. The tracking data is from the National Hurricane Center's Atlantic hurricane database |
| Author | Supportstorm |

|
This file may be updated to reflect new information. If you wish to use a specific version of the file without new updates being mirrored, please upload the required version as a separate file. |
| This work has been released into the public domain by its author, Supportstorm. This applies worldwide. In some countries this may not be legally possible; if so: Supportstorm grants anyone the right to use this work for any purpose, without any conditions, unless such conditions are required by law. |
File history
Click on a date/time to view the file as it appeared at that time.
| Date/Time | Thumbnail | Dimensions | User | Comment | |
|---|---|---|---|---|---|
| current | 01:46, 13 January 2020 | | 4,000 × 2,476 (6.04 MB) | Supportstorm | Track generator created |
| 23:07, 10 April 2019 |  | 3,000 × 1,855 (4.86 MB) | Es204L | sdff | |
| 18:10, 2 March 2019 |  | 3,000 × 2,368 (4.84 MB) | Es204L | Reverted to version as of 02:38, 28 March 2018 (UTC) | |
| 05:00, 30 April 2018 |  | 3,000 × 1,855 (4.86 MB) | Liam Betancourt | Reverted to version as of 03:46, 1 January 2018 (UTC) Current working in adds summary map into dimensions like 2016. | |
| 02:38, 28 March 2018 |  | 3,000 × 2,368 (4.84 MB) | Master0Garfield | Reverted to version as of 19:01, 9 June 2013 (UTC) this is kinda unnecessary. | |
| 03:46, 1 January 2018 |  | 3,000 × 1,855 (4.86 MB) | FrancoLeymas | Standardize size/dimensions | |
| 19:01, 9 June 2013 |  | 3,000 × 2,368 (4.84 MB) | Supportstorm | {{Hurricane season auto track map|start=|end=|source=ATL|type=hurricane|basin=Atlantic|year=2002|author=Supportstorm}} |
File usage
The following pages on the English Wikipedia use this file (pages on other projects are not listed):
- 2002 Atlantic hurricane season
- Hurricane Gustav (2002)
- Hurricane Isidore
- Hurricane Kyle (2002)
- Hurricane Lili
- Timeline of the 2002 Atlantic hurricane season
- Tropical Storm Bertha (2002)
- Tropical Storm Cristobal (2002)
- Tropical Storm Edouard (2002)
- Tropical Storm Fay (2002)
- Tropical Storm Hanna (2002)
- Tropical cyclones in 2002
- User:Icelandic Hurricane/Sandbox
- Template:2002 Atlantic hurricane season buttons
Global file usage
The following other wikis use this file:
- Usage on ar.wikipedia.org
- Usage on de.wikipedia.org
- Usage on es.wikipedia.org
- Usage on fr.wikipedia.org
- Usage on pt.wikipedia.org
- Usage on zh.wikipedia.org
- Portal:美國/特色條目
- 2002年大西洋颶風季
- Wikipedia:典范条目/2014年9月
- 2002年大西洋飓风季时间轴
- Talk:2002年大西洋飓风季时间轴
- Wikipedia:优良条目/2014年11月
- Talk:2002年大西洋颶風季
- Wikipedia:优良条目/2014年11月23日
- Wikipedia:优良条目/2002年大西洋飓风季
- Wikipedia:典范条目/2014年9月20日
- Wikipedia:典范条目/2002年大西洋飓风季
- Portal:美国/特色条目/194
- Wikipedia:典范条目/2015年12月
- Wikipedia:特色列表/2002年大西洋飓风季时间轴
- Wikipedia:典范条目/2015年12月19日
- Wikipedia:典范条目/2016年11月
- Wikipedia:典范条目/2016年11月16日
- Wikipedia:典范条目/2018年3月
- Wikipedia:典范条目/2018年3月9日
- Wikipedia:典范条目/2019年4月
- Wikipedia:典范条目/2019年4月5日
- Wikipedia:典范条目/2021年8月1日
- Wikipedia:典范条目/2021年8月
- Wikipedia:典范条目/2023年2月
- Wikipedia:典范条目/2023年2月10日