
Size of this PNG preview of this SVG file: 800 × 560 pixels. Other resolutions: 320 × 224 pixels | 640 × 448 pixels | 1,024 × 717 pixels | 1,280 × 896 pixels | 2,560 × 1,792 pixels | 2,000 × 1,400 pixels.
Original file (SVG file, nominally 2,000 × 1,400 pixels, file size: 23 KB)
Summary
| Description |
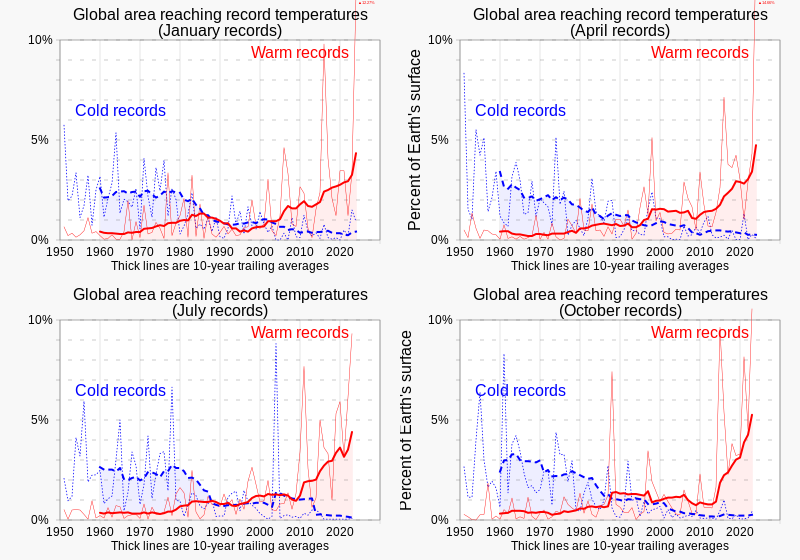
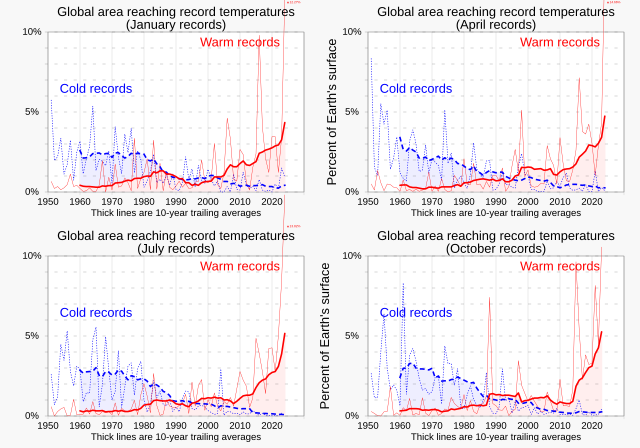
English: Charts comparing percentages of Earth's surface reaching record temperatures since 1951, comparing records for January, April, July and October, from NOAA data.
|
||
| Date | |||
| Source | Own work | ||
| Author | RCraig09 |

Related files
-
 01 January - Percent of global area at temperature records - Global warming - NOAA.svg
(January data) -
 02 February - Percent of global area at temperature records - Global warming - NOAA.svg
(February data) -
 03 March - Percent of global area at temperature records - Global warming - NOAA.svg
(March data) -
 04 April - Percent of global area at temperature records - Global warming - NOAA.svg
(April data) -
 05 May - Percent of global area at temperature records - Global warming - NOAA.svg
(May data) -
 06 June - Percent of global area at temperature records - Global warming - NOAA.svg
(June data)


-
 07 July - Percent of global area at temperature records - Global warming - NOAA.svg
(July data) -
 08 August - Percent of global area at temperature records - Global warming - NOAA.svg
(August data) -
 09 September - Percent of global area at temperature records - Global warming - NOAA.svg
(September data) -
 10 October - Percent of global area at temperature records - Global warming - NOAA.svg
(October data) -
 11 November - Percent of global area at temperature records - Global warming - NOAA.svg
(November data) -
 12 December - Percent of global area at temperature records - Global warming - NOAA.svg
(December data)


-
 1951+ Percent of global area at temperature records - Seasonal comparison - NOAA.svg
Seasonal comparison -
 1951 - Percent of global area at temperature records (monthly) - Global warming - NOAA.svg
All months scatterplot/dot plot -
 1951- RATIO of new record warm temperatures to new record cold temperatures (monthly) - Global warming.svg
Ratios scatterplot/dot plot (monthly) -
 1951- Percent of record temperatures that are cold or warm records.svg
 -
 1951- Warm and cold record temperatures - bar chart.svg

_-_Global_warming_-_NOAA.svg)
_-_Global_warming.svg)


Licensing
I, the copyright holder of this work, hereby publish it under the following license:
This file is licensed under the Creative Commons Attribution-Share Alike 4.0 International license.
- You are free:
- to share – to copy, distribute and transmit the work
- to remix – to adapt the work
- Under the following conditions:
- attribution – You must give appropriate credit, provide a link to the license, and indicate if changes were made. You may do so in any reasonable manner, but not in any way that suggests the licensor endorses you or your use.
- share alike – If you remix, transform, or build upon the material, you must distribute your contributions under the same or compatible license as the original.
File history
Click on a date/time to view the file as it appeared at that time.
| Date/Time | Thumbnail | Dimensions | User | Comment | |
|---|---|---|---|---|---|
| current | 00:23, 24 February 2024 | | 2,000 × 1,400 (23 KB) | RCraig09 | Version 7: Update to include chart showing data for January 2024 |
| 05:38, 16 November 2023 |  | 2,000 × 1,400 (24 KB) | RCraig09 | Version 6: remove minor extraneous characters from October quadrant | |
| 05:34, 16 November 2023 |  | 2,000 × 1,400 (24 KB) | RCraig09 | Version 5: Update with October 2023 chart | |
| 03:57, 15 August 2023 |  | 2,000 × 1,400 (26 KB) | RCraig09 | Version 4: update to include July chart through 2023 | |
| 21:08, 30 July 2023 |  | 2,000 × 1,400 (27 KB) | RCraig09 | Version 3: Add April and October graphics, for four-season comparison | |
| 04:00, 29 July 2023 | 2,000 × 700 (13 KB) | RCraig09 | Version 2: re-centering some text strings | ||
| 22:37, 28 July 2023 | 2,000 × 700 (13 KB) | RCraig09 | Uploaded own work with UploadWizard |
File usage
The following pages on the English Wikipedia use this file (pages on other projects are not listed):
Global file usage
The following other wikis use this file:
- Usage on bn.wikipedia.org
- Usage on cs.wikipedia.org
- Usage on ha.wikipedia.org
- Usage on id.wikipedia.org
- Usage on mk.wikipedia.org
- Usage on zh.wikipedia.org