
Size of this PNG preview of this SVG file: 800 × 450 pixels. Other resolutions: 320 × 180 pixels | 640 × 360 pixels | 1,024 × 576 pixels | 1,280 × 720 pixels | 2,560 × 1,440 pixels | 1,200 × 675 pixels.
Original file (SVG file, nominally 1,200 × 675 pixels, file size: 6 KB)
Summary
| Description |
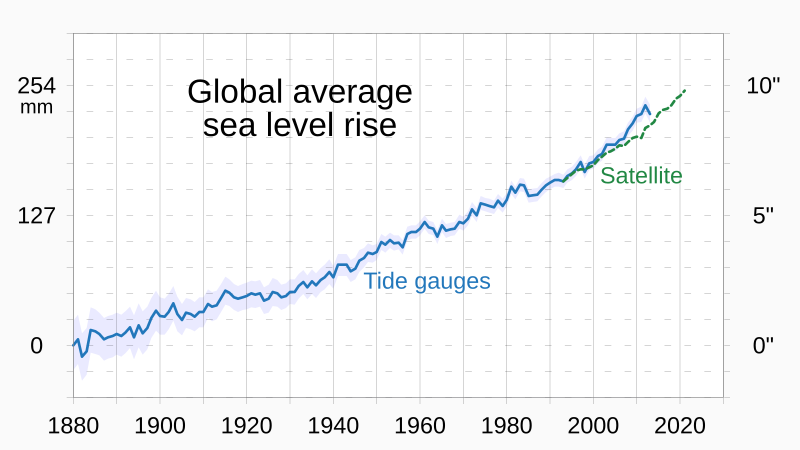
English: Chart showing global average sea level rise (SLR), annually
|
||
| Date | |||
| Source | Own work | ||
| Author | RCraig09 |
_-_annually.svg)
_-_annually.svg)
Licensing
I, the copyright holder of this work, hereby publish it under the following license:
This file is licensed under the Creative Commons Attribution-Share Alike 4.0 International license.
- You are free:
- to share – to copy, distribute and transmit the work
- to remix – to adapt the work
- Under the following conditions:
- attribution – You must give appropriate credit, provide a link to the license, and indicate if changes were made. You may do so in any reasonable manner, but not in any way that suggests the licensor endorses you or your use.
- share alike – If you remix, transform, or build upon the material, you must distribute your contributions under the same or compatible license as the original.
File history
Click on a date/time to view the file as it appeared at that time.
| Date/Time | Thumbnail | Dimensions | User | Comment | |
|---|---|---|---|---|---|
| current | 17:13, 28 October 2023 | | 1,200 × 675 (6 KB) | RCraig09 | Version 2: place international units on left axis, per suggestion on Talk Page |
| 05:53, 26 October 2023 |  | 1,200 × 675 (6 KB) | RCraig09 | Uploaded own work with UploadWizard |
File usage
The following pages on the English Wikipedia use this file (pages on other projects are not listed):
Global file usage
The following other wikis use this file:
- Usage on bn.wikipedia.org
- Usage on cs.wikipedia.org
- Usage on uz.wikipedia.org
_-_annually.svg)