
Size of this PNG preview of this SVG file: 450 × 600 pixels. Other resolutions: 180 × 240 pixels | 360 × 480 pixels | 576 × 768 pixels | 768 × 1,024 pixels | 1,536 × 2,048 pixels | 810 × 1,080 pixels.
Original file (SVG file, nominally 810 × 1,080 pixels, file size: 100 KB)
Summary
| Description |
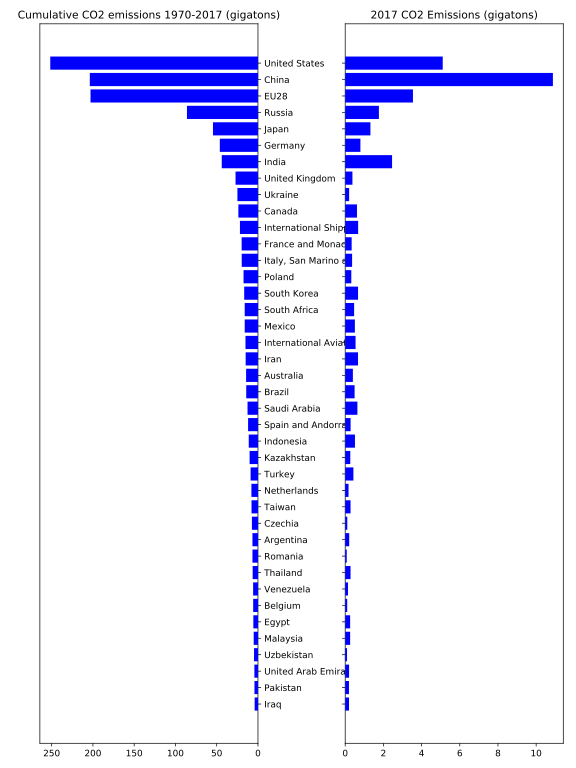
English: The graphed data shows total CO2 emissions from 1970 to 2017 by country, for the top 40 emitters. The right plot shows emissions for 2017 alone. The EDGAR 2018 report (http://edgar.jrc.ec.europa.eu/overview.php?v=booklet2018) updated world carbon emissions for different countries. This data plotted in python using Matplotlib updates existing graphs in Wikimedia that were made using the 2014 report. |
| Date | |
| Source | Own work |
| Author | Mgcontr |
Licensing
I, the copyright holder of this work, hereby publish it under the following license:
This file is licensed under the Creative Commons Attribution-Share Alike 4.0 International license.
- You are free:
- to share – to copy, distribute and transmit the work
- to remix – to adapt the work
- Under the following conditions:
- attribution – You must give appropriate credit, provide a link to the license, and indicate if changes were made. You may do so in any reasonable manner, but not in any way that suggests the licensor endorses you or your use.
- share alike – If you remix, transform, or build upon the material, you must distribute your contributions under the same or compatible license as the original.
File history
Click on a date/time to view the file as it appeared at that time.
| Date/Time | Thumbnail | Dimensions | User | Comment | |
|---|---|---|---|---|---|
| current | 08:36, 24 May 2019 | | 810 × 1,080 (100 KB) | Mgcontr | Same but removed GLOBAL TOTAL |
| 08:11, 24 May 2019 |  | 810 × 1,080 (103 KB) | Mgcontr | User created page with UploadWizard |
File usage
The following pages on the English Wikipedia use this file (pages on other projects are not listed):
Global file usage
The following other wikis use this file:
- Usage on es.wikipedia.org
- Usage on id.wikipedia.org
- Usage on ro.wikipedia.org