
Size of this preview: 443 × 599 pixels. Other resolutions: 177 × 240 pixels | 355 × 480 pixels | 568 × 768 pixels | 758 × 1,024 pixels | 1,320 × 1,784 pixels.
Original file (1,320 × 1,784 pixels, file size: 238 KB, MIME type: image/png)
Summary[edit]
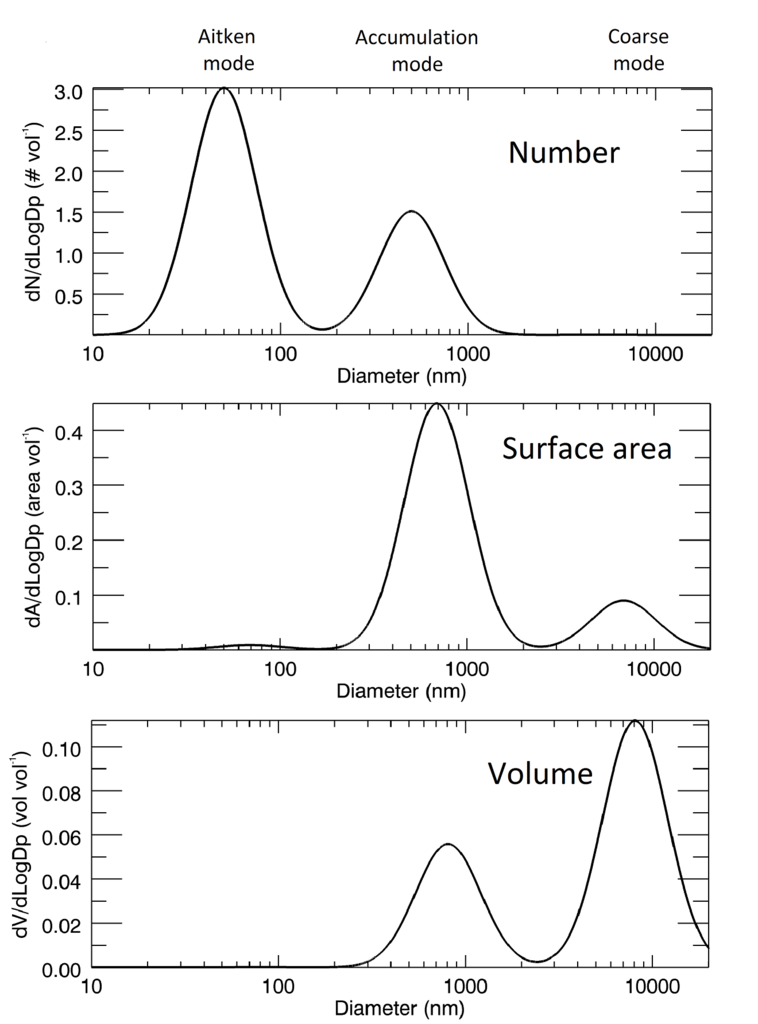
The same synthetic, tri-modal log-normal aerosol distribution plotted in three different spaces : number/size, surface area/size and volume size. Each distribution is normalised so that the area under each curve = 1000. Author: Niall Robinson. Source: Plotted from scratch by Niall Robinson. Niallrobinson (talk) 10:51, 17 September 2012 (UTC)
Licensing[edit]
I, the copyright holder of this work, hereby publish it under the following license:
File history
Click on a date/time to view the file as it appeared at that time.
| Date/Time | Thumbnail | Dimensions | User | Comment | |
|---|---|---|---|---|---|
| current | 11:00, 17 September 2012 | | 1,320 × 1,784 (238 KB) | Niallrobinson (talk | contribs) | this is a lower res version of the picture (File Upload Wizard) |
| 10:52, 17 September 2012 |  | 3,298 × 4,458 (644 KB) | Niallrobinson (talk | contribs) | The same synthetic, tri-modal log-normal aerosol distribution plotted in three different spaces : number/size, surface area/size and volume size. Each distribution is normalised so that the area under each curve = 1000. Author: Niall Robinson. Source: ... | |
| 10:51, 17 September 2012 |  | 3,298 × 4,458 (644 KB) | Niallrobinson (talk | contribs) | The same synthetic, tri-modal log-normal aerosol distribution plotted in three different spaces : number/size, surface area/size and volume size. Each distribution is normalised so that the area under each curve = 1000. Author: Niall Robinson. Source: ... |
You cannot overwrite this file.
File usage
The following pages on the English Wikipedia use this file (pages on other projects are not listed):