
Size of this PNG preview of this SVG file: 575 × 420 pixels. Other resolutions: 320 × 234 pixels | 640 × 467 pixels | 1,024 × 748 pixels | 1,280 × 935 pixels | 2,560 × 1,870 pixels.
Original file (SVG file, nominally 575 × 420 pixels, file size: 4 KB)
Summary
| Description |
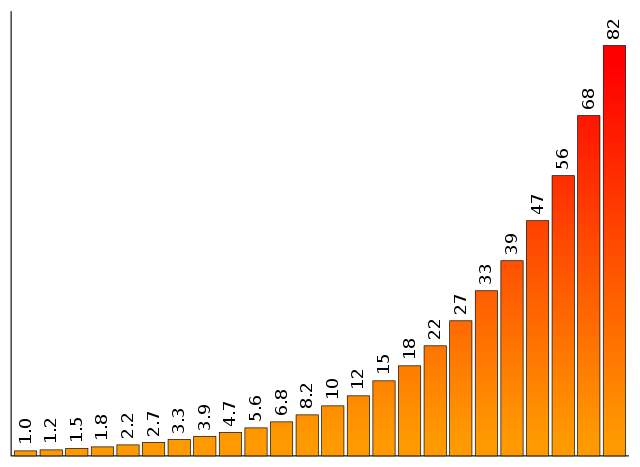
English: Graph showing values of the E12 series, which is used to standardize values of resistors and capacitors. The values shown cover two decades of the series, from 1 to 82, and illustrate the exponential nature of the series. |
| Date | |
| Source | Own work by uploader, designed to replace original bitmap image Image:E12_values_graph.png |
| Author | Qef |
| Other versions | Bitmap version showing the same data, but with superfluous labels, making it not language neutral: Image:E12_values_graph.png |
Licensing
| This work has been released into the public domain by its author, Qef. This applies worldwide. In some countries this may not be legally possible; if so: |
Source code
This graph was generated by the Perl program below, which was specially written for the purpose. If changes need to be made, it's probably best to tweak the program and re-run it to get a new version, rather than editing the SVG directly.
use warnings;
use strict;

# The E12 series twice over, the first time divided by 10.
my @VALUES = qw(
    1.0 1.2 1.5 1.8 2.2 2.7 3.3 3.9 4.7 5.6 6.8 8.2
    10  12  15  18  22  27  33  39  47  56  68  82
);

# Parameters to set appearance.
my $AXIS_HT = 400;
my $VERT_SCALE = 4.5;
my $BAR_WIDTH = 20;
my $BAR_GAP = 3;
my $MARGIN = 10;

my $img_wd = ($BAR_WIDTH + $BAR_GAP) * @VALUES + $BAR_GAP + 2 * $MARGIN;
my $img_ht = $AXIS_HT + 2 * $MARGIN;
my $margin_right = $img_wd - $MARGIN;
my $margin_bottom = $img_ht - $MARGIN;

my $x = $MARGIN;
my $graph_path = '';
my $text_cmds = '';
for (@VALUES) {
    $x += $BAR_GAP;
    my $bar_ht = $_ * $VERT_SCALE;
    $graph_path .= "M$x,$margin_bottom v-$bar_ht h$BAR_WIDTH v$bar_ht Z\n";
    $x += $BAR_WIDTH;
    my $bar_top = $img_ht - $bar_ht - $MARGIN + -5;
    my $txt_x = $x - 0.5 * $BAR_WIDTH + 4.5;
    $text_cmds .= "  <text transform='translate($txt_x,$bar_top) rotate(270)'" .
                  " x='0' y='0' fill='#000' text-anchor='start'>$_</text>\n";
}

print <<"END";
<?xml version="1.0" encoding="UTF-8"?>
<svg version="1.0" width="$img_wd" height="$img_ht"
     xmlns="http://www.w3.org/2000/svg">

 <defs>
  <linearGradient id="grad" x2="0%" y1="0%" y2="100%">
   <stop offset="5%" stop-color="#F00" />
   <stop offset="95%" stop-color="#F90" />
  </linearGradient>
 </defs>

 <path stroke="#000" stroke-width="1" fill="none"
       d="M$MARGIN,$MARGIN V$margin_bottom H$margin_right"/>
 <path stroke="#000" stroke-width="0.6" fill="url(#grad)" d="$graph_path"/>
 <path stroke="#333" stroke-width="0.6" fill="url(#grad)" d="$graph_path">
 </g>
</svg>
END
File history
Click on a date/time to view the file as it appeared at that time.
| Date/Time | Thumbnail | Dimensions | User | Comment | |
|---|---|---|---|---|---|
| current | 17:07, 3 July 2008 | | 575 × 420 (4 KB) | Qef | {{Information |Description={{en|1=Graph showing values of the E12 series, which is used to standardize values of resistors and capacitors. The values shown cover two decades of the series, from 1 to 82, and illustrates the exponential nature of the serie |
File usage
The following pages on the English Wikipedia use this file (pages on other projects are not listed):
- E series of preferred numbers
- User:AllanVolt
- User:AnnonJung
- User:Augur
- User:Berkay123456789
- User:Elsa-and-Anya
- User:FrederickII
- User:HeyTomek
- User:ImmortalRationalist
- User:Java7837/userboxing/Singularitarian
- User:Just an ordinary human
- User:Keskival
- User:KiefKief
- User:MaesterTonberry
- User:Masterhomer
- User:NekrosKoma
- User:Saukkomies/My userboxes
- User:Simen 88
- User:Test35965
- User:Thablaqkgoat
- User:Vaerinn
- User:VinceyB
- Wikipedia:Userboxes/Philosophy
Global file usage
The following other wikis use this file:
- Usage on bg.wikipedia.org
- Usage on da.wikipedia.org
- Usage on de.wikipedia.org
- Usage on en.wikiversity.org
- Usage on eo.wikipedia.org
- Usage on et.wikipedia.org
- Usage on he.wikipedia.org
- Usage on uk.wikipedia.org
- Usage on zh.wikipedia.org