
Size of this preview: 800 × 507 pixels. Other resolutions: 320 × 203 pixels | 640 × 406 pixels | 1,024 × 649 pixels | 1,383 × 877 pixels.
Original file (1,383 × 877 pixels, file size: 132 KB, MIME type: image/jpeg)

|
This graph image could be re-created using vector graphics as an SVG file. This has several advantages; see Commons:Media for cleanup for more information. If an SVG form of this image is available, please upload it and afterwards replace this template with
{{vector version available|new image name}}.
It is recommended to name the SVG file “Belarus - Annual GDP and CPI rates 2001-2013.svg”—then the template Vector version available (or Vva) does not need the new image name parameter. |
Summary
| Description |
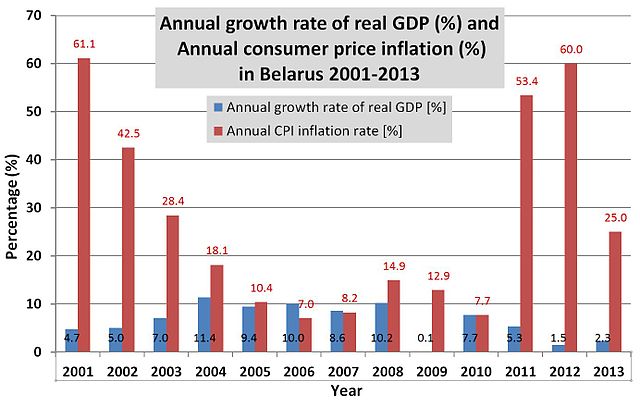
English: Annual growth rate of real GDP (%) and annual consumer price inflation (%) in the Republic of Belarus during 2001-2013. Value for 2013 is partly estimated. Graph is based on statistical data published on the United Nations webpage (http://esango.un.org/sp/ldc_gemu/web/StatPlanet.html). Same data can also be found in annual publications called World Economic Situation and Prospects (e.g., http://www.un.org/en/development/desa/policy/wesp/wesp_current/wesp2014.pdf, see Appendix A2 and A5 in these publications), available freely in pdf format e.g. in English. |
| Date | |
| Source | Own work |
| Author | Paju |
Licensing
I, the copyright holder of this work, hereby publish it under the following license:
This file is licensed under the Creative Commons Attribution-Share Alike 3.0 Unported license.
- You are free:
- to share – to copy, distribute and transmit the work
- to remix – to adapt the work
- Under the following conditions:
- attribution – You must give appropriate credit, provide a link to the license, and indicate if changes were made. You may do so in any reasonable manner, but not in any way that suggests the licensor endorses you or your use.
- share alike – If you remix, transform, or build upon the material, you must distribute your contributions under the same or compatible license as the original.
File history
Click on a date/time to view the file as it appeared at that time.
| Date/Time | Thumbnail | Dimensions | User | Comment | |
|---|---|---|---|---|---|
| current | 12:33, 17 May 2014 | | 1,383 × 877 (132 KB) | Paju~commonswiki | User created page with UploadWizard |
File usage
The following pages on the English Wikipedia use this file (pages on other projects are not listed):
Global file usage
The following other wikis use this file:
- Usage on fi.wikipedia.org
- Usage on id.wikipedia.org
- Usage on simple.wikipedia.org
- Usage on sr.wikipedia.org
- Usage on te.wikipedia.org
- Usage on vi.wikipedia.org