
Original file (1,842 × 1,442 pixels, file size: 111 KB, MIME type: image/png)
| Description |
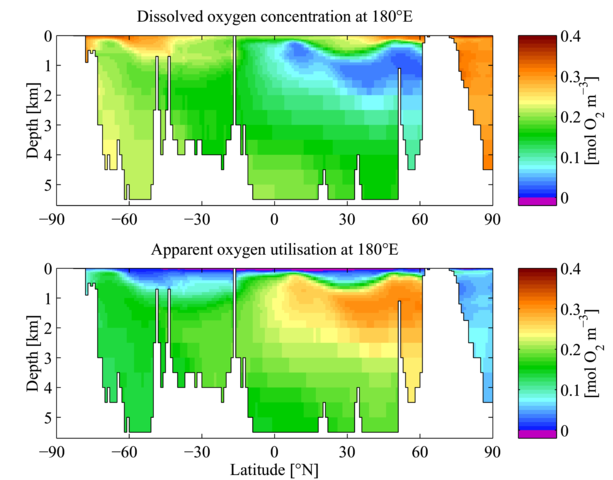
Annual mean dissolved oxygen (upper panel) and apparent oxygen utilisation (lower panel) from the World Ocean Atlas 2005. The data plotted show a meridional section running north-south at 180°E (approximately the centre of the Pacific Ocean). White regions indicate section bathymetry. The plot was produced using MATLAB. While dissolved oxygen concentrations are necessarily always positive, apparent oxygen utilisation can be both positive and negative (shown here in magenta). Positive values indicate regions where oxygen has been consumed to concentrations below its equilibrium saturation concentration. Negative values indicate regions in which the dissolved oxygen concentration is elevated above its equilibrium saturation concentration, typically in near-surface euphotic waters by primary production and the resulting oxygen evolution. |
|---|---|
| Source |
Own work |
| Date |
20 November 2007 |
| Author | |
| Permission (Reusing this file) |
See below.
|
Summary[edit]
Annual mean dissolved oxygen (upper panel) and apparent oxygen utilisation (lower panel) from the World Ocean Atlas 2005. The data plotted show a meridional section running north-south at 180°E (approximately the centre of the Pacific Ocean). White regions indicate section bathymetry. The plot was produced using MATLAB.
While dissolved oxygen concentrations are necessarily always positive, apparent oxygen utilisation can be both positive and negative (shown here in magenta). Positive values indicate regions where oxygen has been consumed to concentrations below its equilibrium saturation concentration. Negative values indicate regions in which the dissolved oxygen concentration is elevated above its equilibrium saturation concentration, typically in near-surface euphotic waters by primary production and the resulting oxygen evolution.
Licensing[edit]
File history
Click on a date/time to view the file as it appeared at that time.
| Date/Time | Thumbnail | Dimensions | User | Comment | |
|---|---|---|---|---|---|
| current | 16:27, 20 November 2007 | | 1,842 × 1,442 (111 KB) | Plumbago (talk | contribs) | Annual mean dissolved oxygen (upper panel) and apparent oxygen utilisation (lower panel) from the World Ocean Atlas [http://www.nodc.noaa.gov/OC5/WOA05/pr_woa05.html 2005]. The data plotted show a meridional section r |
You cannot overwrite this file.