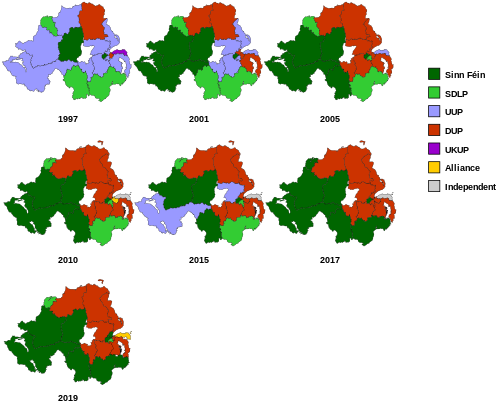
This article lists the election results and representation of the Democratic Unionist Party with respect to the House of Commons of the United Kingdom,
House of Commons[edit]

| Election year | # of total votes | % of overall vote | # of seats won (NI) | Outcome |
|---|---|---|---|---|
| Feb 1974[1] | 58,656 |
0.2% |
1 / 12
|
Opposition |
| Oct 1974[2] | 59,451 |
0.3% |
1 / 12 |
Opposition |
| 1979[3] | 70,795 |
0.2% |
3 / 12 |
Opposition |
| 1983[4] | 152,749 |
0.5% |
3 / 17 |
Opposition |
| 1987[5] | 85,642 |
0.3% |
3 / 17 |
Opposition |
| 1992[6] | 103,039 |
0.3% |
3 / 17 |
Opposition |
| 1997[7] | 107,348 |
0.3% |
2 / 18 |
Opposition |
| 2001[8] | 181,999 |
0.7% |
5 / 18 |
Opposition |
| 2005[9] | 241,856 |
0.9% |
9 / 18 |
Opposition |
| 2010[10] | 168,216 |
0.6% |
8 / 18 |
Opposition |
| 2015[11] | 184,260 |
0.6% |
8 / 18 |
Opposition |
| 2017[12] | 292,316 |
0.9% |
10 / 18 |
Confidence and supply (Con minority gov't) |
| 2019 | 244,127 |
0.8% |
8 / 18 |
Opposition |
Northern Ireland Assembly election results[edit]
| Election | Northern Ireland Assembly | Total Votes | Share of votes | Seats | +/- | Government |
|---|---|---|---|---|---|---|
| 1973 | 1973 Assembly | 78,228 | 10.8% | 8 / 78
|
Opposition | |
| 1975 | Constitutional Convention | 97,073 | 14.8% | 12 / 78
|
Fourth largest party | |
| 1982 | 1982 Assembly | 145,528 | 23.0% | 21 / 78
|
Opposition | |
| 1996 | Forum | 141,413 | 18.8% | 24 / 110
|
Second largest party | |
| 1998 | 1st Assembly | 145,917 | 18.5% | 20 / 108
|
Junior party in coalition | |
| 2003 | 2nd Assembly | 177,944 | 25.7% | 30 / 108
|
Largest party, direct rule | |
| 2007 | 3rd Assembly | 207,721 | 30.1% | 36 / 108
|
Coalition | |
| 2011 | 4th Assembly | 198,436 | 30.0% | 38 / 108
|
Coalition | |
| 2016 | 5th Assembly | 202,567 | 29.2% | 38 / 108
|
Coalition | |
| 2017 | 6th Assembly | 225,413 | 28.1% | 28 / 90
|
Coalition | |
| 2022 | 7th Assembly | 184,002 | 21.33% | 25 / 90
|
TBD |
European Parliament election results[edit]
| Election | European Parliament | First-preference votes | Share of first-preference votes | Seats (NI) | +/- | Alliance |
|---|---|---|---|---|---|---|
| 1979 | First Parliament | 230,251 | 33.6% | 1 / 3
|
n/a | Non-Inscrits |
| 1984 | Second Parliament | 170,688 | 29.8% | 1 / 3
|
Non-Inscrits | |
| 1989 | Third Parliament | 160,110 | 29.9% | 1 / 3
|
Non-Inscrits | |
| 1994 | Fourth Parliament | 163,246 | 29.2% | 1 / 3
|
Non-Inscrits | |
| 1999 | Fifth Parliament | 192,762 | 28.4% | 1 / 3
|
Non-Inscrits | |
| 2004 | Sixth Parliament | 175,761 | 32.0% | 1 / 3
|
Non-Inscrits | |
| 2009 | Seventh Parliament | 88,346 | 18.2% | 1 / 3
|
Non-Inscrits | |
| 2014 | Eighth Parliament | 131,163 | 20.9% | 1 / 3
|
Non-Inscrits | |
| 2019 | Ninth Parliament | 124,991 | 21.8% | 1 / 3
|
Non-Inscrits |
References[edit]
- ^ "2005 General election results". UK Political Info. Retrieved 18 October 2015.
- ^ "2005 General election results". UK Political Info. Retrieved 18 October 2015.
- ^ "2005 General election results". UK Political Info. Retrieved 18 October 2015.
- ^ "2005 General election results". UK Political Info. Retrieved 18 October 2015.
- ^ "2005 General election results". UK Political Info. Retrieved 18 October 2015.
- ^ "2005 General election results". UK Political Info. Retrieved 18 October 2015.
- ^ "2005 General election results". UK Political Info. Retrieved 18 October 2015.
- ^ "2005 General election results". UK Political Info. Retrieved 18 October 2015.
- ^ "2005 General election results". UK Political Info. Retrieved 18 October 2015.
- ^ "Election 2010 Results". BBC News. Retrieved 22 January 2014.
- ^ "UK 2015 general election results in full", The Guardian,
- ^ "Results of the 2017 General Election". BBC News. Retrieved 9 June 2017.