
Wind power in Illinois provided nearly 10% of the state's generated electrical power in 2020 powering 1,231,900 homes.[1] At the end of 2020, Illinois had 6,300 megawatts (MW) of wind power installed, ranking fifth among states for installed wind turbine capacity.[2] An additional 1,100 MW of wind power was under construction across the state at the end of 2020.
The vast majority of wind-generated electricity in Illinois is distributed via Midcontinent Independent System Operator, which services Illinois outside of northern Illinois—as opposed to PJM Interconnection, which distributes electricity in the Chicago metropolitan area.[3]
Overview[edit]

Wind power has been supported by a renewable portfolio standard, passed in 2007, and strengthened in 2009, which requires 10% renewable energy from electric companies by 2010 and 25% by 2025.[4] For 2013, in-state renewable generation was just 5.1% of Illinois' total generation.[5] Additional renewably generated electricity is imported from other states.[6] Illinois uses a large amount of electricity, and the state's mandate was enacted when only a very small percentage of its electricity was renewably generated.
Illinois has the potential for installing up to an estimated 249,882 MW of wind generation capacity at a hub height of 80 meters operating at 30% gross capacity factor.[7][8] That amount is lower with higher capacity factors and is higher with 100 meter hub heights.[8]
The first wind farm in Illinois opened in 2003 and by 2009, it had over 1800 MW installed statewide with thousands of MW more in the planning stages.[9] The largest wind farm in the state is the 300 MW Cayuga Ridge installation, while another seven windfarms each exceeded MW capacity.[3] The Twin Groves Wind Farm was the largest wind farm east of the Mississippi when completed but has since been surpassed.[10][11] Some smaller installations include a 0.66 MW turbine at the Bureau Valley School District and a 2.5 MW turbine at the Illinois Sustainable Technology Center, formerly part of the Illinois Department of Natural Resources, now part of the University of Illinois.[3] A proposed high voltage DC transmission line would transmit wind generated electrical power to the Chicago area from northwest Iowa.[12]
Power from some wind farms in Illinois is sold to the Tennessee Valley Authority. A 2010 agreement with Iberdrola Renewables provides a potential 300MW future supply from the Streator Cayuga Ridge Wind Farm in Livingston County.[13]
Wind farms[edit]


| Farm | Year | Installed capacity (MW) | County[14] | Note |
|---|---|---|---|---|
| Mendota Hills | 2003/2019 | 51.66/76 | Lee | Turbines replaced in 2019 |
| Crescent Ridge | 2005 | 54.45 | Bureau | |
| Pike County | 2005 | 1.65 | Pike | |
| GSG | 2007 | 80 | Lee/LaSalle | |
| Camp Grove | 2007 | 150 | Marshall/Stark | |
| Twin Groves I-II | 2007-2008 | 396 | McLean | |
| AgriWind | 2008 | 8.4 | Bureau | |
| Grand Ridge I-IV | 2008-2009 | 210 | LaSalle | |
| Providence Heights | 2008 | 72 | Bureau | |
| EcoGrove | 2009 | 100.5 | Stephenson | |
| Rail Splitter | 2009 | 100.5 | Logan/Tazewell | |
| Lee-DeKalb | 2009 | 217.5 | Lee/DeKalb | |
| Cayuga Ridge | 2009 | 300 | Livingston | |
| Geneseo | 2009 | 3 | Henry | |
| Top Crop I-II | 2009-2010 | 300 | LaSalle | |
| Streator Cayuga Ridge | 2010 | 150 | Livingston | |
| Walnut Ridge | 2010 | 212 | Bureau | |
| White Oak | 2011 | 150 | McLean | |
| Big Sky Wind | 2011 | 239.4 | Bureau/Lee | |
| Pioneer Trail | 2011 | 150 | Iroquois/Ford | |
| Settlers Trail | 2011 | 150 | Iroquois | |
| Shady Oaks[15] | 2012 | 109.5 | Lee | |
| Bishop Hill | 2012 | 200 | Henry | |
| Minonk | 2012 | 200 | Woodford/Livingston | |
| California Ridge[16] | 2012 | 217.1 | Vermilion/Champaign | |
| Bishop Hill I-II | 2012 | 81 | Henry | |
| Heartland Community College | 2012 | 1.65 | McLean | |
| Pilot Hill | 2014 | 175 | Iroquois/Kankakee | |
| Brown County | 2014 | 1.5 | Brown | |
| Hoopeston | 2015 | 98 | Vermilion | |
| Kelly Creek[17] | 2016 | 184 | Kankakee/Ford | |
| Radford Run | 2017 | 306 | Macon | |
| Bishop Hill III | 2018 | 132 | Henry | |
| HillTopper | 2018 | 185 | Logan | |
| Whitney Hill | 2019 | 66 | Logan | |
| Bright Stalk | 2019 | 205 | McLean | |
| Green River | 2019 | 194 | Lee/Whiteside | |
| Cardinal Point | 2020 | 150 | McDonough/Warren | |
| Harvest Ridge | 2020 | 200 | Douglas | |
| Otter Creek | 2020 | 158 | LaSalle | |
| Broadlands | 2020 | 200 | Champaign | |
| Sugar Creek | 2020 | 202 | Logan | |
| Blooming Grove | 2020 | 261 | McLean | |
| Lone Tree | 2020 | 88 | Bureau | |
| Lincoln Land | 2021 | 302 | Morgan | |
| Glacier Sands | 2021 | 185 | Mason [18] | |
| Bennington | 2021 | 93 | Marshall | |
| Ford Ridge | 2022 | 120.4 | Ford | |
| Sapphire Sky | 2023 | 253.8 | McLean |
Wind generation[edit]
| Illinois Wind Generation (GWh, Million kWh) | ||||||||||||||
|---|---|---|---|---|---|---|---|---|---|---|---|---|---|---|
| Year | Jan | Feb | Mar | Apr | May | Jun | Jul | Aug | Sep | Oct | Nov | Dec | Total | % of Production |
| 2003 | 2 | 1 | 1 | 1 | 1 | 1 | 2 | 2 | 1 | 1 | 1 | 2 | 16 | |
| 2004 | 0 | 3 | 8 | 10 | 9 | 5 | 3 | 4 | 5 | 9 | 9 | 13 | 78 | |
| 2005 | 6 | 7 | 10 | 10 | 9 | 5 | 3 | 2 | 5 | 7 | 12 | 65 | 141 | |
| 2006 | 19 | 18 | 23 | 29 | 21 | 14 | 13 | 10 | 15 | 28 | 28 | 36 | 254 | |
| 2007 | 28 | 21 | 28 | 51 | 64 | 40 | 26 | 26 | 66 | 106 | 95 | 112 | 663 | |
| 2008 | 240 | 189 | 201 | 226 | 208 | 160 | 82 | 69 | 93 | 229 | 298 | 342 | 2,337 | |
| 2009 | 252 | 302 | 264 | 306 | 204 | 148 | 97 | 147 | 101 | 259 | 329 | 411 | 2,820 | |
| 2010 | 357 | 242 | 402 | 503 | 392 | 218 | 205 | 196 | 373 | 524 | 609 | 432 | 4,453 | |
| 2011 | 407 | 598 | 567 | 723 | 538 | 423 | 239 | 224 | 402 | 512 | 908 | 672 | 6,213 | |
| 2012 | 880 | 613 | 869 | 782 | 641 | 565 | 320 | 277 | 443 | 771 | 608 | 958 | 7,727 | |
| 2013 | 1,185 | 880 | 999 | 1,077 | 766 | 594 | 413 | 323 | 511 | 739 | 1,209 | 929 | 9,625 | |
| 2014 | 1,313 | 849 | 1,069 | 1,097 | 873 | 621 | 498 | 351 | 458 | 842 | 1,285 | 829 | 10,085 | 4.98% |
| 2015 | 1,004 | 936 | 1,000 | 1,073 | 890 | 518 | 400 | 444 | 628 | 1,167 | 1,372 | 1,316 | 10,748 | 5.54% |
| 2016 | 1,268 | 1,144 | 1,096 | 1,026 | 854 | 591 | 400 | 331 | 693 | 960 | 1,095 | 1,205 | 10,663 | 5.69% |
| 2017 | 1,125 | 1,264 | 1,304 | 1,289 | 1,086 | 941 | 471 | 408 | 519 | 1,166 | 1,245 | 1,450 | 12,268 | 6.68% |
| 2018 | 1,531 | 1,198 | 1,284 | 1,096 | 859 | 616 | 566 | 571 | 679 | 1,172 | 1,065 | 1,262 | 11,899 | 6.33% |
| 2019 | 1,471 | 1,308 | 1,491 | 1,623 | 1,134 | 1,034 | 673 | 562 | 900 | 1,293 | 1,242 | 1,729 | 14,460 | 7.24% |
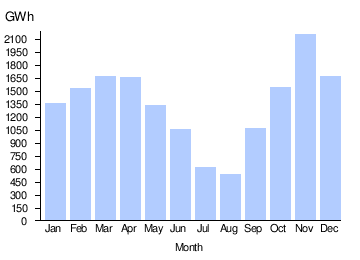
| 2020 | 1,364 | 1,535 | 1,672 | 1,657 | 1,336 | 1,054 | 621 | 543 | 1,070 | 1,542 | 2,159 | 1,673 | 16,226 | 8.56% |
| 2021 | 1,537 | 1,643 | 2,113 | 1,770 | 1,553 | 1,146 | 807 | 895 | 1,388 | 1,514 | 2,064 | 2,257 | 19,133 | 9.37% |
| 2022 | 2,262 | 2,277 | 2,325 | 2,503 | 2,141 | 1,407 | 1,149 | 1,041 | 1,271 | 2,052 | 2,498 | 2,137 | 23,063 | 12.16% |
| 2023 | 1,939 | 2,381 | 2,558 | 2,266 | 1,690 | 1,307 | 863 | 1,175 | 1,173 | 2,156 | 2,302 | 2,243 | 22,054 | 12.40% |
| 2024 | 2,168 | 2,365 | 4,533 | 14.62% | ||||||||||
Teal background indicates the largest wind generation month for the year.
Green background indicates the largest wind generation month to date.
 |
| Net Generation for Wind, Monthly[21] |
 |
| Net Generation for Wind, Monthly[22] |
 |
| Megawatts of Installed Generating Capacity[24][25][26][27] |
See also[edit]
- Solar power in Illinois
- Rock Island Clean Line
- Wind power in the United States
- Renewable energy in the United States
References[edit]
- ^ "WINDExchange: Wind Energy in Illinois". windexchange.energy.gov. Retrieved November 13, 2021.
- ^ "Illinois - State Energy Profile Analysis - U.S. Energy Information Administration (EIA)". www.eia.gov. Retrieved November 13, 2021.
- ^ a b c U.S. Wind Energy Projects - Illinois Archived 2010-01-05 at the Wayback Machine, American Wind Energy Association (AWEA)
- ^ "Illinois Incentives/Policies for Renewables & Efficiency". Database of State Incentives for Renewables and Efficiency. U.S. Dept. of Energy. Archived from the original on July 16, 2011. Retrieved May 17, 2010.
- ^ "Electric Power Monthly, February 2014". U.S. Energy Information Administration.
{{cite web}}: Missing or empty|url=(help) - ^ "Fix for Illinois renewable energy law faces utility opposition". midwestenergynews.com. Archived from the original on March 13, 2017. Retrieved April 26, 2018.
- ^ "Wind Energy Facts: Illinois" (PDF). American Wind Energy Association. Archived from the original (PDF) on February 15, 2013. Retrieved February 17, 2013.
- ^ a b "WindExchange:Illinois 80-meter wind map and wind resource potential". U.S. Department of Energy, EERE. Archived from the original on July 14, 2014. Retrieved July 2, 2014.
- ^ About Wind Power in Illinois Archived 2010-06-07 at the Wayback Machine, Illinois Wind Energy Association
- ^ AWEA treats Twin Groves as four installations. Together they exceed the capacity of Cayuga Ridge.
- ^ Lookout puts wind farm in perspective Archived 2011-06-13 at the Wayback Machine, Steve Stein, Peoria Journal Star, June 14, 2008
- ^ "Rock Island Clean Line files application with FERC" (PDF). Clean Line Energy Partners. November 8, 2011. Retrieved February 3, 2012.
- ^ "TVA: Energy Purchases from Wind Farms". tva.com. Archived from the original on July 31, 2015.
- ^ "Illinois Wind Power Maps". windforillinois.org. Archived from the original on June 29, 2012. Retrieved April 26, 2018.
- ^ Shady Oaks profile Archived 2014-05-11 at the Wayback Machine
- ^ "Our Projects - Invenergy". www.invenergyllc.com. Archived from the original on March 16, 2016. Retrieved April 26, 2018.
- ^ Kelly Creek Wind Park Commissioned Archived 2016-12-29 at the Wayback Machine
- ^ Glacier Sands Wind Project
- ^ EIA (May 21, 2013). "Electric Power Monthly". United States Department of Energy. Archived from the original on June 3, 2013. Retrieved June 3, 2013.
- ^ "Electricity Data Browser". www.eia.gov. Archived from the original on March 23, 2018. Retrieved April 26, 2018.
- ^ "Electricity Data Browser". www.eia.gov. Archived from the original on March 23, 2018. Retrieved April 26, 2018.
- ^ "Electricity Data Browser". www.eia.gov. Archived from the original on March 23, 2018. Retrieved April 26, 2018.
- ^ "Installed Wind Capacity". U.S. Department of Energy. Archived from the original on March 14, 2014. Retrieved March 19, 2015.
- ^ "AWEA 4th quarter 2011 Public Market Report" (PDF). American Wind Energy Association(AWEA). January 2012. Retrieved February 3, 2012.
- ^ "AWEA 4th quarter 2018 Public Market Report". American Wind Energy Association(AWEA). January 2012. Retrieved March 6, 2019.
- ^ WINDExchange: U.S. Installed and Potential Wind Power Capacity and Generation
- ^ "Market Report 2021". American Clean Power Association. May 17, 2022. Retrieved May 22, 2022.
External links[edit]
- Illinois Wind, a project of the Illinois Institute for Rural Affairs, Western Illinois University
- Maps of operating and proposed wind power projects in Illinois
- GA Mansoori, N Enayati, LB Agyarko (2016), Energy: Sources, Utilization, Legislation, Sustainability, Illinois as Model State, World Sci. Pub. Co., ISBN 978-981-4704-00-7
| Wind power by state |
| |
|---|---|---|
| Large wind farms | ||
| Offshore wind farms |
| |
| Wind power companies | ||
Well, that’s interesting to know that Psilotum nudum are known as whisk ferns. Psilotum nudum is the commoner species of the two. While the P. flaccidum is a rare species and is found in the tropical islands. Both the species are usually epiphytic in habit and grow upon tree ferns. These species may also be terrestrial and grow in humus or in the crevices of the rocks.
View the detailed Guide of Psilotum nudum: Detailed Study Of Psilotum Nudum (Whisk Fern), Classification, Anatomy, Reproduction