Kamp-Lintfort | |
|---|---|
 Terraced gardens of Kamp Abbey | |
 Flag  Coat of arms | |
Location of Kamp-Lintfort within Wesel district 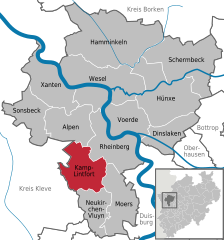 | |
 Kamp-Lintfort  Kamp-Lintfort | |
| Coordinates: 51°30′00″N 06°32′0″E / 51.50000°N 6.53333°E | |
| Country | Germany |
| State | North Rhine-Westphalia |
| Admin. region | Düsseldorf |
| District | Wesel |
| Government | |
| • Mayor (2020–25) | Christoph Landscheidt[1] (SPD) |
| Area | |
| • Total | 63.16 km2 (24.39 sq mi) |
| Elevation | 33 m (108 ft) |
| Population (2022-12-31)[2] | |
| • Total | 38,665 |
| • Density | 610/km2 (1,600/sq mi) |
| Time zone | UTC+01:00 (CET) |
| • Summer (DST) | UTC+02:00 (CEST) |
| Postal codes | 47475 |
| Dialling codes | 0 28 42 |
| Vehicle registration | WES |
| Website | www |
Kamp-Lintfort (German: [ˌkampˈlɪnt.fɔʁt] ⓘ) is a town in Wesel District, in North Rhine-Westphalia, Germany. It is located 8 kilometres (5 miles) north-west of Moers.
Notable people[edit]
- Jacob Wiener (1815-1899), medallist and engraver.
- Adolf Storms (1919–2010), member of the Waffen-SS and war criminal
- Brigitte Asdonk (born 1947), founding member of the Red Army Faction
Twin towns – sister cities[edit]
Kamp-Lintfort is twinned with:[3]
 Edremit, Turkey
 Żory, Poland
 Chester-Le-Street, England
 Cambrai, France
Climate[edit]
Köppen-Geiger climate classification system classifies its climate as oceanic (Cfb).[4] It lies within the Rhine-Ruhr area which is characterized by having the warmest winters in Germany.
| Climate data for Kamp-Lintfort | |||||||||||||
|---|---|---|---|---|---|---|---|---|---|---|---|---|---|
| Month | Jan | Feb | Mar | Apr | May | Jun | Jul | Aug | Sep | Oct | Nov | Dec | Year |
| Mean daily maximum °C (°F) | 4.3 (39.7) |
5.4 (41.7) |
9.6 (49.3) |
14 (57) |
18.5 (65.3) |
21.5 (70.7) |
22.9 (73.2) |
22.7 (72.9) |
19.7 (67.5) |
14.6 (58.3) |
8.8 (47.8) |
5.5 (41.9) |
14.0 (57.1) |
| Daily mean °C (°F) | 1.9 (35.4) |
2.5 (36.5) |
6.2 (43.2) |
9.3 (48.7) |
13.3 (55.9) |
16.3 (61.3) |
17.9 (64.2) |
17.8 (64.0) |
15.1 (59.2) |
10.7 (51.3) |
6.1 (43.0) |
3.2 (37.8) |
10.0 (50.0) |
| Mean daily minimum °C (°F) | −0.5 (31.1) |
−0.3 (31.5) |
2.8 (37.0) |
4.6 (40.3) |
8.2 (46.8) |
11.2 (52.2) |
13 (55) |
12.9 (55.2) |
10.5 (50.9) |
6.9 (44.4) |
3.5 (38.3) |
0.9 (33.6) |
6.1 (43.0) |
| Average precipitation mm (inches) | 67 (2.6) |
48 (1.9) |
63 (2.5) |
52 (2.0) |
68 (2.7) |
81 (3.2) |
76 (3.0) |
69 (2.7) |
63 (2.5) |
63 (2.5) |
65 (2.6) |
75 (3.0) |
790 (31.2) |
| Source: Climate-Data.org (altitude: 29m)[4] | |||||||||||||
References[edit]
- ^ Wahlergebnisse in NRW Kommunalwahlen 2020, Land Nordrhein-Westfalen, accessed 30 June 2021.
- ^ "Bevölkerung der Gemeinden Nordrhein-Westfalens am 31. Dezember 2022 – Fortschreibung des Bevölkerungsstandes auf Basis des Zensus vom 9. Mai 2011" (in German). Landesbetrieb Information und Technik NRW. Retrieved 20 June 2023.
- ^ "Partnerschaften". kamp-lintfort.de (in German). Kamp-Lintfort. Retrieved 2021-02-15.
- ^ a b "Temperature, Climate graph, Climate table for Kamp-Lintfort". Climate-Data.org. Retrieved 2017-09-25.
Towns and municipalities in Wesel (district) | ||
|---|---|---|
 | ||
| International | |
|---|---|
| National | |
| Geographic | |