East Northamptonshire District Council in Northamptonshire, England was elected every four years. After the last boundary changes in 2007, 40 councillors were elected from 22 wards.[1] The district was abolished in 2021, with the area becoming part of North Northamptonshire.
Political control[edit]
From the first election to the council in 1973 until its abolition in 2021, political control of the council was held by the following parties:[2]
| Party in control | Years | |
|---|---|---|
| Conservative | 1973–1995 | |
| Labour | 1995–1999 | |
| Conservative | 1999–2021 | |
Leadership[edit]
The leaders of the council from 2009 until the council's abolition in 2021 were:
| Councillor | Party | From | To | |
|---|---|---|---|---|
| Andy Mercer | Conservative | Oct 2010 | ||
| Steven North[3] | Conservative | 4 Oct 2010 | 31 Mar 2021 | |
Council elections[edit]
- 1973 East Northamptonshire District Council election
- 1976 East Northamptonshire District Council election
- 1979 East Northamptonshire District Council election (New ward boundaries)[4]
- 1983 East Northamptonshire District Council election
- 1987 East Northamptonshire District Council election
- 1991 East Northamptonshire District Council election
- 1995 East Northamptonshire District Council election
- 1999 East Northamptonshire District Council election (New ward boundaries)[5][6]
- 2003 East Northamptonshire District Council election
- 2007 East Northamptonshire District Council election (New ward boundaries increased the number of seats by 4)[2][7]
- 2011 East Northamptonshire District Council election
- 2015 East Northamptonshire District Council election (Some new ward boundaries)[8]
Election results[edit]
| Overall control | Conservative | Labour | Lib Dem[a] | Independent | |||||
| 2015 | Conservative | 37 | 1 | - | 2 | ||||
| 2011 | Conservative | 35 | 2 | - | 3 | ||||
| 2007 | Conservative | 39 | - | - | 1 | ||||
| 2003 | Conservative | 33 | 3 | - | - | ||||
| 1999 | Conservative | 20 | 15 | - | 1 | ||||
| 1995 | Labour | 9 | 25 | 2 | - | ||||
| 1991 | Conservative | 23 | 9 | 3 | 1 | ||||
| 1987 | Conservative | 30 | 5 | 1 | - | ||||
| 1983 | Conservative | 30 | 6 | - | - | ||||
| 1979 | Conservative | 30 | 5 | - | 1 | ||||
- ^ SDP–Liberal Alliance in 1987.
District result maps[edit]
-
 1979 results map
 -
 1983 results map
 -
 1987 results map
 -
 1991 results map
 -
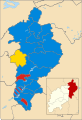
 1995 results map
 -
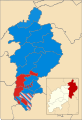 1999 results map
 -
 2003 results map
 -
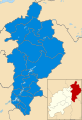 2007 results map
 -
 2011 results map


By-election results[edit]
1995-1999[edit]
| Party | Candidate | Votes | % | ±% | |
|---|---|---|---|---|---|
| Labour | 656 | 75.4 | |||
| Conservative | 214 | 24.6 | |||
| Majority | 442 | 50.8 | |||
| Turnout | 870 | 22.4 | |||
| Labour hold | Swing | ||||
| Party | Candidate | Votes | % | ±% | |
|---|---|---|---|---|---|
| Labour | 325 | 65.1 | |||
| Conservative | 174 | 34.9 | |||
| Majority | 151 | 30.2 | |||
| Turnout | 499 | ||||
| Labour hold | Swing | ||||
| Party | Candidate | Votes | % | ±% | |
|---|---|---|---|---|---|
| Labour | 365 | 43.3 | |||
| Conservative | 352 | 41.7 | |||
| Independent | 127 | 15.1 | |||
| Majority | 13 | 1.6 | |||
| Turnout | 844 | 18.5 | |||
| Labour hold | Swing | ||||
| Party | Candidate | Votes | % | ±% | |
|---|---|---|---|---|---|
| Labour | 712 | 67.0 | |||
| Conservative | 351 | 33.0 | |||
| Majority | 361 | 34.0 | |||
| Turnout | 1,063 | ||||
| Labour hold | Swing | ||||
| Party | Candidate | Votes | % | ±% | |
|---|---|---|---|---|---|
| Conservative | 525 | 55.7 | +15.2 | ||
| Labour | 418 | 44.3 | -15.2 | ||
| Majority | 107 | 11.4 | |||
| Turnout | 943 | 16.1 | |||
| Conservative gain from Labour | Swing | ||||
1999-2003[edit]
| Party | Candidate | Votes | % | ±% | |
|---|---|---|---|---|---|
| Conservative | 316 | 64.5 | -6.6 | ||
| Labour | 174 | 35.5 | +6.6 | ||
| Majority | 142 | 29.0 | |||
| Turnout | 490 | 37.9 | |||
| Conservative hold | Swing | ||||
| Party | Candidate | Votes | % | ±% | |
|---|---|---|---|---|---|
| Conservative | 366 | 83.9 | |||
| Labour | 70 | 16.1 | |||
| Majority | 296 | 67.8 | |||
| Turnout | 436 | ||||
| Conservative hold | Swing | ||||
| Party | Candidate | Votes | % | ±% | |
|---|---|---|---|---|---|
| Conservative | 379 | 67.7 | -3.4 | ||
| Labour | 181 | 32.3 | +3.4 | ||
| Majority | 198 | 35.4 | |||
| Turnout | 560 | ||||
| Conservative hold | Swing | ||||
2003-2007[edit]
| Party | Candidate | Votes | % | ±% | |
|---|---|---|---|---|---|
| Conservative | unopposed | ||||
| Conservative hold | Swing | ||||
| Party | Candidate | Votes | % | ±% | |
|---|---|---|---|---|---|
| Conservative | Sean Lever | 506 | 66.4 | +21.5 | |
| Labour | Stephen Allen | 256 | 33.6 | -2.9 | |
| Majority | 250 | 32.8 | |||
| Turnout | 762 | 15.8 | |||
| Conservative hold | Swing | ||||
2007-2011[edit]
| Party | Candidate | Votes | % | ±% | |
|---|---|---|---|---|---|
| Conservative | Pam Whiting | unopposed | |||
| Conservative hold | Swing | ||||
2011-2015[edit]
| Party | Candidate | Votes | % | ±% | |
|---|---|---|---|---|---|
| Conservative | Derek Capp | 412 | 64.1 | N/A | |
| Liberal Democrats | Karen Draycott | 130 | 20.2 | N/A | |
| Labour | Phil Garnham | 101 | 15.7 | N/A | |
| Majority | 282 | 43.9 | |||
| Turnout | 643 | ||||
| Conservative hold | Swing | ||||
| Party | Candidate | Votes | % | ±% | |
|---|---|---|---|---|---|
| Conservative | Jake Vowles | 1,003 | 52.4 | -13.7 | |
| Labour | Paul King | 681 | 35.6 | +1.7 | |
| Liberal Democrats | George Smid | 230 | 12.0 | +12.0 | |
| Majority | 322 | 16.8 | |||
| Turnout | 1,914 | ||||
| Conservative hold | Swing | ||||
| Party | Candidate | Votes | % | ±% | |
|---|---|---|---|---|---|
| Conservative | Alex Smith | 396 | 43.1 | -12.4 | |
| Independent | Valerie Carter | 210 | 22.9 | +22.9 | |
| Labour | Alex Izycky | 166 | 18.1 | +18.1 | |
| UKIP | Joseph Garner | 146 | 15.9 | +15.9 | |
| Majority | 186 | 20.3 | |||
| Turnout | 918 | ||||
| Conservative hold | Swing | ||||
2015-2021[edit]
| Party | Candidate | Votes | % | ±% | |
|---|---|---|---|---|---|
| Conservative | Annabel de Capell Brooke | 729 | 82.8 | +6.7 | |
| Labour | Alan Brookfield | 151 | 17.2 | +2.8 | |
| Majority | 578 | 65.6 | |||
| Turnout | 880 | ||||
| Conservative hold | Swing | ||||
| Party | Candidate | Votes | % | ±% | |
|---|---|---|---|---|---|
| Conservative | Harriet Pentland | 611 | 55.6 | N/A | |
| Liberal Democrats | Suzanna Austin | 244 | 22.2 | N/A | |
| Labour | Mark Smith | 189 | 17.2 | N/A | |
| Green | Simon Turner | 33 | 3.0 | N/A | |
| UKIP | Bill Cross | 22 | 2.0 | N/A | |
| Majority | 367 | 33.4 | |||
| Turnout | 1,099 | ||||
| Conservative hold | Swing | ||||
| Party | Candidate | Votes | % | ±% | |
|---|---|---|---|---|---|
| Conservative | Lee Wilkes | 542 | 53.1 | -2.3 | |
| Labour | Caroline Cross | 478 | 46.9 | +11.7 | |
| Majority | 64 | 6.3 | |||
| Turnout | 1,020 | ||||
| Conservative hold | Swing | ||||
| Party | Candidate | Votes | % | ±% | |
|---|---|---|---|---|---|
| Conservative | Bert Jackson | 1,379 | 63.3 | +16.1 | |
| Liberal Democrats | Suzanna Austin | 800 | 36.7 | +36.7 | |
| Majority | 579 | 26.6 | |||
| Turnout | 2,179 | ||||
| Conservative hold | Swing | ||||
| Party | Candidate | Votes | % | ±% | |
|---|---|---|---|---|---|
| Conservative | Peter Tomas | 1,531 | 62.6 | N/A | |
| Liberal Democrats | Simon Baylis | 913 | 37.4 | N/A | |
| Majority | 618 | 25.2 | |||
| Turnout | 2,444 | ||||
| Conservative hold | Swing | ||||
References[edit]
- ^ "Councillors - general information". East Northamptonshire Council. Archived from the original on 29 August 2006. Retrieved 14 March 2010.
- ^ a b "East Northamptonshire". BBC News Online. Retrieved 14 March 2010.
- ^ "Council minutes, 4 October 2010". East Northamptonshire District Council. Retrieved 21 June 2022.
- ^ The District of East Northamptonshire (Electoral Arrangements) Order 1976
- ^ "East Northamptonshire". BBC News Online. Retrieved 14 March 2010.
- ^ legislation.gov.uk - The District of East Northamptonshire (Electoral Changes) Order 1998. Retrieved on 4 October 2015.
- ^ legislation.gov.uk - The District of East Northamptonshire (Electoral Changes) Order 2007. Retrieved on 3 November 2015.
- ^ legislation.gov.uk - The East Northamptonshire (Electoral Changes) Order 2015. Retrieved on 3 November 2015.
- ^ "No Brent bounce for Lib Dems". guardian.co.uk. 26 September 2003. Retrieved 14 March 2010.
- ^ "Declaration of result of poll" (PDF). East Northamptonshire Council. Retrieved 14 March 2010. [dead link]
- ^ "Notice of uncontested election" (PDF). East Northamptonshire Council. Retrieved 14 March 2010. [dead link]
- ^ "Local Elections Archive Project — Barnwell Ward". www.andrewteale.me.uk. Retrieved 18 February 2024.
- ^ "Local Elections Archive Project — Oundle Ward". www.andrewteale.me.uk. Retrieved 18 February 2024.
- ^ "Local Elections Archive Project — Thrapston Market Ward". www.andrewteale.me.uk. Retrieved 18 February 2024.
- ^ "Local Elections Archive Project — Prebendal Ward". www.andrewteale.me.uk. Retrieved 18 February 2024.
- ^ "Local Elections Archive Project — Higham Ferrers Lancaster Ward". www.andrewteale.me.uk. Retrieved 18 February 2024.
- ^ "Local Elections Archive Project — Irthlingborough Waterloo Ward". www.andrewteale.me.uk. Retrieved 18 February 2024.
- ^ "Local Elections Archive Project — Higham Ferrers Chichele Ward". www.andrewteale.me.uk. Retrieved 18 February 2024.
- ^ "Local Elections Archive Project — Higham Ferrers Lancaster Ward". www.andrewteale.me.uk. Retrieved 18 February 2024.
- By-election results Archived 29 March 2010 at the Wayback Machine