Rodersdorf | |
|---|---|
 Rodersdorf village church | |
 Coat of arms | |
Location of Rodersdorf  | |
 Rodersdorf  Rodersdorf | |
| Coordinates: 47°29′N 7°27′E / 47.483°N 7.450°E | |
| Country | Switzerland |
| Canton | Solothurn |
| District | Dorneck |
| Area | |
| • Total | 5.29 km2 (2.04 sq mi) |
| Elevation | 391 m (1,283 ft) |
| Population (31 December 2018)[2] | |
| • Total | 1,310 |
| • Density | 250/km2 (640/sq mi) |
| Time zone | UTC+01:00 (Central European Time) |
| • Summer (DST) | UTC+02:00 (Central European Summer Time) |
| Postal code(s) | 4118 |
| SFOS number | 2479 |
| ISO 3166 code | CH-SO |
| Surrounded by | Biederthal (FR-68), Leymen (FR-68), Liebenswiller (FR-68), Metzerlen-Mariastein, Oltingue (FR-68) |
| Website | www SFSO statistics |
Rodersdorf is a municipality in the district of Dorneck in the canton of Solothurn in Switzerland, on the border to Alsace, France.
History[edit]
Rodersdorf is first mentioned in 1226 as Ratolsdorf. In 1349 it was mentioned as Roderstorff.[3]
Geography[edit]

Rodersdorf has an area, as of 2009[update], of 5.34 square kilometers (2.06 sq mi). Of this area, 2.9 km2 (1.1 sq mi) or 54.3% is used for agricultural purposes, while 1.63 km2 (0.63 sq mi) or 30.5% is forested. Of the rest of the land, 0.76 km2 (0.29 sq mi) or 14.2% is settled (buildings or roads) and 0.01 km2 (2.5 acres) or 0.2% is unproductive land.[4]
Of the built up area, housing and buildings made up 8.8% and transportation infrastructure made up 3.7%. while parks, green belts and sports fields made up 1.5%. Out of the forested land, 28.7% of the total land area is heavily forested and 1.9% is covered with orchards or small clusters of trees. Of the agricultural land, 41.9% is used for growing crops and 9.9% is pastures, while 2.4% is used for orchards or vine crops.[4]
The municipality is located in the Dorneck district, in the upper Leimen valley. The municipality is located in an exclave of the Canton of Solothurn, bordered by Basel-Country and Alsace.
Coat of arms[edit]
The blazon of the municipal coat of arms is Per pale Gules and Argent two Fishes embowed addorsed counterchanged.[5]
Demographics[edit]
Rodersdorf has a population (as of December 2020[update]) of 1,375.[6] As of 2008[update], 8.9% of the population are resident foreign nationals.[7] Over the last 10 years (1999–2009 ) the population has changed at a rate of -1.6%.[8]
Most of the population (as of 2000[update]) speaks German (1,229 or 96.1%), with French being second most common (16 or 1.3%) and English being third (12 or 0.9%). There is 1 person who speaks Romansh.[9]
As of 2008[update], the gender distribution of the population was 49.0% male and 51.0% female. The population was made up of 564 Swiss men (43.2% of the population) and 75 (5.7%) non-Swiss men. There were 603 Swiss women (46.2%) and 63 (4.8%) non-Swiss women.[10] Of the population in the municipality 300 or about 23.5% were born in Rodersdorf and lived there in 2000. There were 79 or 6.2% who were born in the same canton, while 682 or 53.3% were born somewhere else in Switzerland, and 178 or 13.9% were born outside of Switzerland.[9]
In 2008[update] there were 7 live births to Swiss citizens and were 5 deaths of Swiss citizens. Ignoring immigration and emigration, the population of Swiss citizens increased by 2 while the foreign population remained the same. There were 2 Swiss men who immigrated back to Switzerland. At the same time, there was 1 non-Swiss man who immigrated from another country to Switzerland. The total Swiss population change in 2008 (from all sources, including moves across municipal borders) was a decrease of 8 and the non-Swiss population remained the same. This represents a population growth rate of -0.6%.[7]
The age distribution, as of 2000[update], in Rodersdorf is; 110 children or 8.6% of the population are between 0 and 6 years old and 242 teenagers or 18.9% are between 7 and 19. Of the adult population, 54 people or 4.2% of the population are between 20 and 24 years old. 321 people or 25.1% are between 25 and 44, and 434 people or 33.9% are between 45 and 64. The senior population distribution is 96 people or 7.5% of the population are between 65 and 79 years old and there are 22 people or 1.7% who are over 80.[11]
As of 2000[update], there were 507 people who were single and never married in the municipality. There were 696 married individuals, 29 widows or widowers and 47 individuals who are divorced.[9]
As of 2000[update], there were 469 private households in the municipality, and an average of 2.7 persons per household.[8] There were 78 households that consist of only one person and 46 households with five or more people. Out of a total of 474 households that answered this question, 16.5% were households made up of just one person. Of the rest of the households, there are 158 married couples without children, 200 married couples with children There were 31 single parents with a child or children. There were 2 households that were made up of unrelated people and 5 households that were made up of some sort of institution or another collective housing.[9]
In 2000[update] there were 333 single family homes (or 80.4% of the total) out of a total of 414 inhabited buildings. There were 27 multi-family buildings (6.5%), along with 44 multi-purpose buildings that were mostly used for housing (10.6%) and 10 other use buildings (commercial or industrial) that also had some housing (2.4%). Of the single family homes 32 were built before 1919, while 59 were built between 1990 and 2000. The greatest number of single family homes (103) were built between 1971 and 1980.[12]
In 2000[update] there were 484 apartments in the municipality. The most common apartment size was 5 rooms of which there were 170. There were 4 single room apartments and 309 apartments with five or more rooms. Of these apartments, a total of 458 apartments (94.6% of the total) were permanently occupied, while 19 apartments (3.9%) were seasonally occupied and 7 apartments (1.4%) were empty.[12] As of 2009[update], the construction rate of new housing units was 1.6 new units per 1000 residents.[8] The vacancy rate for the municipality, in 2010[update], was 0.58%.[8]
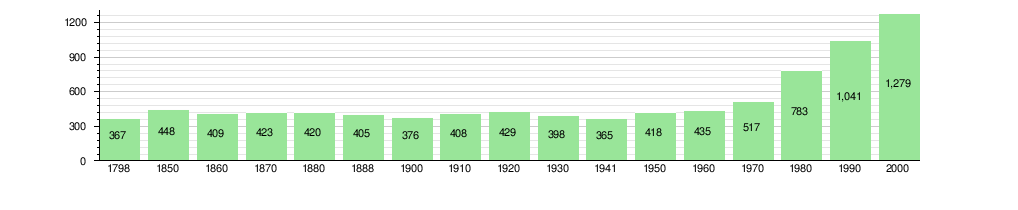
The historical population is given in the following chart:[3][13]
Sights[edit]
The entire village of Rodersdorf is part of the Inventory of Swiss Heritage Sites.[14]
Politics[edit]
In the 2007 federal election the most popular party was the SP which received 28.42% of the vote. The next three most popular parties were the SVP (21.31%), the Green Party (18.51%) and the CVP (15.71%). In the federal election, a total of 605 votes were cast, and the voter turnout was 63.4%.[15]
Economy[edit]
As of 2010[update], Rodersdorf had an unemployment rate of 1.3%. As of 2008[update], there were 34 people employed in the primary economic sector and about 10 businesses involved in this sector. 34 people were employed in the secondary sector and there were 6 businesses in this sector. 69 people were employed in the tertiary sector, with 28 businesses in this sector.[8] There were 647 residents of the municipality who were employed in some capacity, of which females made up 42.3% of the workforce.
In 2008[update] the total number of full-time equivalent jobs was 105. The number of jobs in the primary sector was 21, all of which were in agriculture. The number of jobs in the secondary sector was 32 of which 18 or (56.3%) were in manufacturing and 14 (43.8%) were in construction. The number of jobs in the tertiary sector was 52. In the tertiary sector; 6 or 11.5% were in wholesale or retail sales or the repair of motor vehicles, 4 or 7.7% were in the movement and storage of goods, 10 or 19.2% were in a hotel or restaurant, 1 was in the information industry, 2 or 3.8% were the insurance or financial industry, 8 or 15.4% were technical professionals or scientists, 8 or 15.4% were in education.[16]
In 2000[update], there were 115 workers who commuted into the municipality and 525 workers who commuted away. The municipality is a net exporter of workers, with about 4.6 workers leaving the municipality for every one entering. About 29.6% of the workforce coming into Rodersdorf are coming from outside Switzerland.[17] Of the working population, 40% used public transportation to get to work, and 42.2% used a private car.[8]
Religion[edit]

From the 2000 census[update], 429 or 33.5% were Roman Catholic, while 403 or 31.5% belonged to the Swiss Reformed Church. Of the rest of the population, there were 3 individuals (or about 0.23% of the population) who belonged to the Christian Catholic Church, and there were 38 individuals (or about 2.97% of the population) who belonged to another Christian church. There were 3 (or about 0.23% of the population) who were Islamic. There were 2 individuals who were Buddhist, 6 individuals who were Hindu and 2 individuals who belonged to another church. 355 (or about 27.76% of the population) belonged to no church, are agnostic or atheist, and 38 individuals (or about 2.97% of the population) did not answer the question.[9]
Education[edit]
In Rodersdorf about 510 or (39.9%) of the population have completed non-mandatory upper secondary education, and 270 or (21.1%) have completed additional higher education (either university or a Fachhochschule). Of the 270 who completed tertiary schooling, 58.1% were Swiss men, 30.0% were Swiss women, 9.6% were non-Swiss men and 2.2% were non-Swiss women.[9]
During the 2010–2011 school year there were a total of 89 students in the Rodersdorf school system. The education system in the Canton of Solothurn allows young children to attend two years of non-obligatory Kindergarten.[18] During that school year, there were 17 children in kindergarten. The canton's school system requires students to attend six years of primary school, with some of the children attending smaller, specialized classes. In the municipality there were 72 students in primary school. The secondary school program consists of three lower, obligatory years of schooling, followed by three to five years of optional, advanced schools. All the lower secondary students from Rodersdorf attend their school in a neighboring municipality.[19]
As of 2000[update], there were 154 students from Rodersdorf who attended schools outside the municipality.[17]
Transportation[edit]
Rodersdorf is the terminus of the 10 line of Baselland Transport.
References[edit]
- ^ a b "Arealstatistik Standard - Gemeinden nach 4 Hauptbereichen". Federal Statistical Office. Retrieved 13 January 2019.
- ^ "Ständige Wohnbevölkerung nach Staatsangehörigkeitskategorie Geschlecht und Gemeinde; Provisorische Jahresergebnisse; 2018". Federal Statistical Office. 9 April 2019. Retrieved 11 April 2019.
- ^ a b Rodersdorf in German, French and Italian in the online Historical Dictionary of Switzerland.
- ^ a b Swiss Federal Statistical Office-Land Use Statistics 2009 data (in German) accessed 25 March 2010
- ^ Flags of the World.com accessed 23-March-2011
- ^ "Ständige und nichtständige Wohnbevölkerung nach institutionellen Gliederungen, Geburtsort und Staatsangehörigkeit". bfs.admin.ch (in German). Swiss Federal Statistical Office - STAT-TAB. 31 December 2020. Retrieved 21 September 2021.
- ^ a b Swiss Federal Statistical Office - Superweb database - Gemeinde Statistics 1981-2008 (in German) accessed 19 June 2010
- ^ a b c d e f Swiss Federal Statistical Office accessed 23-March-2011
- ^ a b c d e f STAT-TAB Datenwürfel für Thema 40.3 - 2000 Archived 2014-04-09 at the Wayback Machine (in German) accessed 2 February 2011
- ^ Canton of Solothurn Statistics - Wohnbevölkerung der Gemeinden nach Nationalität und Geschlecht Archived 2011-03-05 at the Wayback Machine (in German) accessed 11 March 2011
- ^ Canton of Solothurn Statistics - Wohnbevölkerung nach Gemeinden, Nationalität, Altersgruppen und Zivilstand, Total (Männer + Frauen) Archived 2011-07-07 at the Wayback Machine (in German) accessed 11 March 2011
- ^ a b Federal Statistical Office STAT-TAB - Datenwürfel für Thema 09.2 - Gebäude und Wohnungen Archived 2015-01-21 at the Wayback Machine (in German) accessed 28 January 2011
- ^ Swiss Federal Statistical Office STAT-TAB Bevölkerungsentwicklung nach Region, 1850-2000 Archived 2014-09-30 at the Wayback Machine (in German) accessed 29 January 2011
- ^ "Kantonsliste A-Objekte:Solothurn" (PDF). KGS Inventar (in German). Federal Office of Civil Protection. 2009. Archived from the original (PDF) on 18 July 2011. Retrieved 12 July 2010.
- ^ Swiss Federal Statistical Office, Nationalratswahlen 2007: Stärke der Parteien und Wahlbeteiligung, nach Gemeinden/Bezirk/Canton (in German) accessed 28 May 2010
- ^ Swiss Federal Statistical Office STAT-TAB Betriebszählung: Arbeitsstätten nach Gemeinde und NOGA 2008 (Abschnitte), Sektoren 1-3 Archived 2014-12-25 at the Wayback Machine (in German) accessed 28 January 2011
- ^ a b Swiss Federal Statistical Office - Statweb Archived 2012-08-04 at archive.today (in German) accessed 24 June 2010
- ^ Canton of Solothurn - Education information Archived 2011-05-08 at the Wayback Machine (in German) accessed 11 March 2011
- ^ Canton of Solothurn - School statistics Archived 2011-07-07 at the Wayback Machine (in German) accessed 13 March 2011
External links[edit]
- Official website (in German)
Municipalities in Dorneck District, Switzerland | ||
|---|---|---|
| International | |
|---|---|
| National | |
| Other | |