Size of this preview: 800 × 570 pixels. Other resolutions: 320 × 228 pixels | 640 × 456 pixels | 1,037 × 739 pixels.
Original file (1,037 × 739 pixels, file size: 72 KB, MIME type: image/jpeg)
Summary[edit]
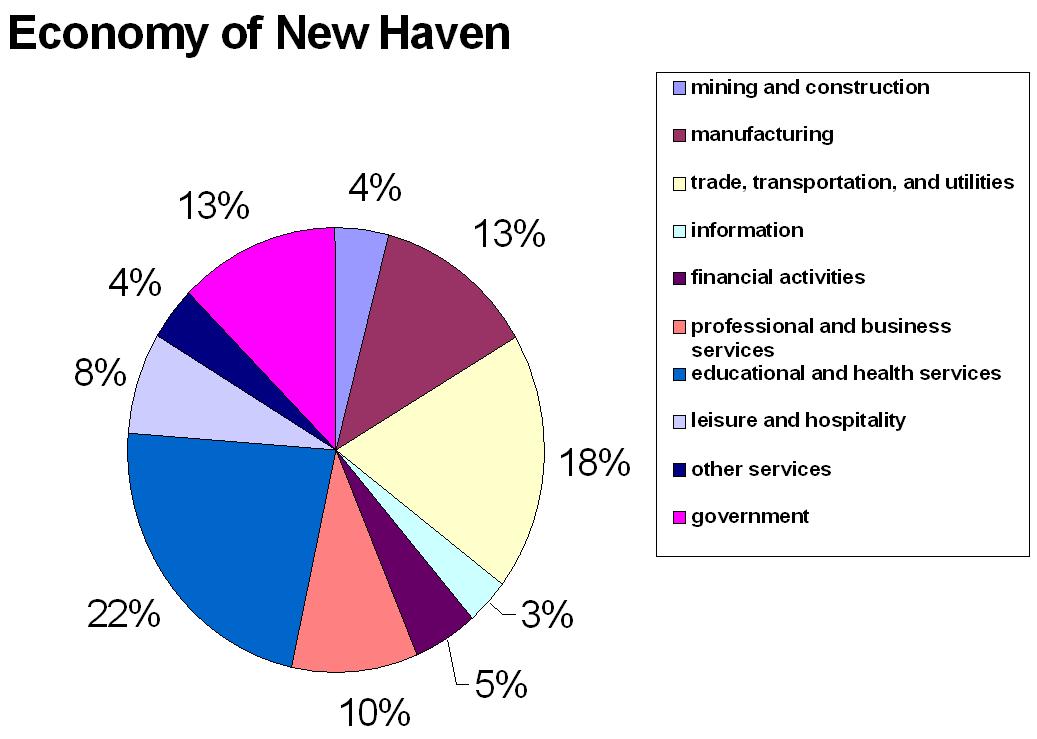
A pie chart made in Excel demonstrating the distribution of the economy of New Haven, Connecticut. Data taken from [1], using the following data:
mining and construction: 11,500
manufacturing: 34,000
trade, transportation, and utilities: 50,300
information: 8,700
financial activities: 14,100
professional and business services: 25,900
educational and health services: 61,700
leisure and hospitality: 20,500
other services: 10,500
government: 34,200
Licensing[edit]
File history
Click on a date/time to view the file as it appeared at that time.
| Date/Time | Thumbnail | Dimensions | User | Comment | |
|---|---|---|---|---|---|
| current | 01:51, 4 July 2007 | | 1,037 × 739 (72 KB) | Loodog (talk | contribs) | == Summary == A pie chart made in Excel demonstrating the distribution of the economy of New Haven, Connecticut. Data taken from [http://www.city-data.com/us-cities/The-Northeast/New-Haven-Economy.html], using the following data: mining and construc |
You cannot overwrite this file.
File usage
No pages on the English Wikipedia use this file (pages on other projects are not listed).