| 2014–15 North American winter | |
|---|---|
 A temperature map of the frigid conditions in North America on November 13, 2014 | |
| Seasonal boundaries | |
| Meteorological winter | December 1 – February 28 |
| Astronomical winter | December 21 – March 20 |
| First event started | November 8, 2014 |
| Last event concluded | May 9, 2015 |
| Most notable event | |
| Name | January 31 – February 2, 2015 North American blizzard |
| • Duration | January 30–February 3, 2015 |
| • Lowest pressure | 978 mb (28.88 inHg) |
| • Fatalities | 15 total |
| • Damage | Unknown (2015 USD) |
| Seasonal statistics | |
| Total storms (RSI) (Cat. 1+) | 10 total (record high, tied with 2010–11 and 2013–14) |
| Major storms (RSI) (Cat. 3+) | 2 total |
| Maximum snowfall accumulation |
|
| Maximum ice accretion |
|
| Total fatalities | 101 total |
| Total damage | ≥ $546 million (2015 USD) |
| Related articles | |
The 2014–15 North American winter was frigid and prolifically wintry, especially across the eastern half of North America in the months of January–March. The season began early, with many places in North America experiencing their first wintry weather during mid-November. A period of below-average temperatures affected much of the contiguous United States, and several records were broken. An early trace of snowfall was recorded in Arkansas.[1] There were greater accumulations of snow across parts of Oklahoma as well.[2] A quasi-permanent phenomenon referred to as the polar vortex may have been partly responsible for the cold weather. Temperatures in much of the United States dropped 15 to 35 °F (8.3 to 19 °C) below average by November 19, following a southward "dip" of the polar vortex into the eastern two-thirds of the country. The effects of this dip were widespread, bringing about temperatures as low as 28 °F (−2 °C) in Pensacola, Florida.[3] Following a significant snowstorm there, Buffalo, New York received several feet of snow from November 17–21.[4] In addition, significant winter weather occurred throughout the season, including a major blizzard that struck the Northeastern United States at the end of January, another blizzard that affected much of the Northern United States days later in early February, and several significant snow events paired with very frigid temperatures for much of February.
Many records for snowfall and temperature were broken, many for the month of February, with every state east of the Mississippi River being colder than average, some for the entire winter. However, this meteorological winter was the 19th-warmest of the past 120 winters over the Contiguous United States, largely due to persistent warm weather in the Western United States.[5] During the 2014–15 winter season, Boston broke its all-time official seasonal 107.6-inch (2.73-meter) snowfall record from the winter of 1995–96, with a total snowfall record of 108.6 inches (2.76 m) as of March 15, 2015.[6]
While there is no well-agreed-upon date used to indicate the start of winter in the Northern Hemisphere, there are two definitions of winter which may be used. Based on the astronomical definition, winter begins at the winter solstice, which in 2014 occurred on December 21, and ends at the March equinox, which in 2015 occurred on March 20.[7] Based on the meteorological definition, the first day of winter is December 1 and the last day February 28.[8] Both definitions involve a period of approximately three months, with some variability.
Seasonal forecasts[edit]


On October 16, 2014, the National Oceanic and Atmospheric Administration's Climate Prediction Center issued its U.S. Winter Outlook. This outlook indicated that below-average temperatures in parts of the south-central and southeastern United States would be favored, with above-average temperatures favored in the western U.S., Alaska, Hawaii, and New England. Drought conditions were expected to improve in California's southern and northwestern regions, but no improvements were expected earlier than December or January. Above-average conditions were also expected to pervade the winter months in the western U.S., the Intermountain West extending across the U.S.–Canada border through New York and New England, and Alaska and Hawaii. The Precipitation Outlook favored above-average precipitation across the southern tier and Atlantic coast of the United States, with above-average precipitation also favored in southern Alaska and the Alaska panhandle. Below-average precipitation was favored in Hawaii, the northwestern United States, and near the Great Lakes region. The rest of the country was given an "equal chance" for either above- or below-average temperatures and/or precipitation.[9]
On November 30, 2014, Environment Canada's monthly prediction system produced a forecast for the months of December, January, and February across Canada. Areas in and just off the western coast of British Columbia were considered the most likely areas for above-average temperatures. Other areas where above-average temperatures were favored by the forecast included Yukon, the Northwest Territories, northern parts of Alberta and Saskatchewan, and northwestern parts of Manitoba. Below-average temperatures were favored in and near Lake Superior in Ontario, across much of Hudson Bay, in far-eastern parts of Nunavut, and in northern parts of Quebec. The most favorable locations for above-average precipitation were northwestern British Columbia, southwestern Yukon, eastern parts of the Northwest Territories, western parts of Nunavut, and Newfoundland. The most favorable areas for below-average precipitation were southeastern British Columbia, southern Alberta, southern Saskatchewan, some northern parts of Quebec, and an isolated spot in the northern half of Nunavut.[10]
Seasonal summary[edit]

The North American winter season of 2014–15 expressed a significant level of variance. First, a cyclone in the Bering Sea enabled a change in the atmospheric pattern to occur; according to Jeff Masters from Weather Underground, this cyclone brought about a "ripple" in the jet stream, and the presence of a high-pressure ridge over the western United States and a low-pressure trough over the southern and central United States enabled a great intrusion of very cold air to pervade southward out of Canada.[3] Following the onset of the cold wave, multiple snow events occurred; one significant storm dropped as much as 88 inches (220 cm) of snow in a single area, and impacts covered a broad area.[4] In late November, around Thanksgiving, a nor'easter traveled up the East Coast, dropping up to a foot of snow in some areas, and causing major travel headaches for much of the country.[11] Due to the storm, over 4,500 flights were canceled and over 400,000 people were without power on November 27; southern New Hampshire was the worst hit, experiencing up to 200,000 outages.[11] December was, at the time, the second warmest across the US.[12] However, 2015, 2021 and 2023 have since had warmer Decembers, leaving 2014 in fifth.[13][14][15] In December, yet another storm impacted parts of North America; the storm brought relief to drought-stricken parts of California, but it also brought dangerous mudflows to fire-ravaged areas where the soil could not handle the excess precipitation.[16] Less than two weeks after this event, another storm impacted the Pacific coast of the United States; this storm, fueled by the "Pineapple Express", knocked out power to over one hundred thousand customers in the San Francisco Bay Area after producing strong winds. Hurricane-force winds were reported in parts of the northwestern United States. Regions reported as much as 9 inches (23 cm) of rainfall, and parts of the Sierra Nevada reported 19 inches (48 cm) of snowfall.[17]

Due to a persistent stationary high-pressure pattern over the west coast that redirects the jet stream, it remained (and remains) in a wavy ideal configuration to bring warm air north over the western U.S. and cold air towards the south over the continental states, and to favor winter storms over the East Coast. Severe winter blizzards over New England are often associated with this configuration, and nearly all of the snow storms this season followed very similar tracks and had marked similarities in their synoptic evolution. Boston in particular saw the effects of this, experiencing six major snow storms in the first two months of the year, leaving it with over 105 inches (270 cm) of snow. January 27 saw first major snowfall of 2015, with observations showing a blocked flow with warm air over the west coast, accompanied by a pronounced cold trough downstream, which pattern looks very similar to the blizzard that Boston saw on January 23, 2005.[18]
As a result, February was record-breaking for many cities in the United States, yet in opposite extremes. Much of February saw below-average cold in the eastern part of the country, it was markedly warm in the West. A multitude of cities east of the Mississippi experienced their coldest February in decades, including Chicago, Ill.; Cleveland, Oh.; Grand Rapids, Mich.; Harrisburg, Pa.; Hartford, Conn.; and Portland, Maine. Marquette, Mich. Syracuse, Buffalo and Rochester, N.Y. also set records for coldest month overall,[19] as did Bangor, Maine where the average temperature was 6.1 °F (−14.4 °C). And with an average temperature of 2.5 °F (−16.4 °C), the state of Maine itself also set a record low. For Worcester, Mass, February was the coldest month out of any month on record with an average temperature of just 14.2 °F (−9.9 °C), while also accumulating more than 110 inches (280 cm) of snow this winter.
In contrast, in the West a persistently strong ridge of high pressure over the warm eastern Pacific Ocean and western North America elevated temperatures to record levels from Arizona to Washington. It was the warmest winter month (December, January, February) on record in San Francisco; Seattle; Portland, Ore.; Reno, Nev.; Las Vegas; and Salt Lake City, with the latter realizing an average temperature for February of 43.9 °F (6.6 °C), breaking the old record set in 1907. Meanwhile, just 1.1 inches (2.8 cm) of snow fell in the entire month in Anchorage, Alaska, making it the fifth-least-snowy February on record.[20]
Portland and Salem had their warmest February on record, with the latter tying the record set in 1934 for their warmest at 45.9 °F (7.7 °C) degrees with the year. For the first time in record keeping, every day in February was at least 50 °F (10 °C) in Salem.[21]
California averaged 1.5 °F (0.83 °C) warmer than the previous warmest winter (2013–14), which had broken the previous record (1980–81) by 0.8 °F (−17.3 °C). February was the warmest on record in Washington, California, Utah and Arizona, while February was among the top 10 warmest in four other states. Overall, the National Oceanic and Atmospheric Administration reported that about 30.6 percent of the country was "very warm" – meaning February was in the warmest 10 percent of the historical record – while 31.5 percent of the country was "very cold," or in the coldest 10 percent historically.[5]
Events[edit]
There were several winter weather events during the 2014–15 North American winter. Significant events include cold waves, snowstorms, and other notable events outside the conventional limits of winter.
November Bering Sea cyclone[edit]
  | |
| Duration | November 8–13, 2014 |
|---|---|
| Lowest pressure | 920 mb (27.17 inHg) |
| Fatalities | 0 fatalities |
| Damage | Unknown (2014 USD) |
In early November 2014, Typhoon Nuri peaked in intensity as a Category 5-equivalent typhoon on the Saffir–Simpson hurricane wind scale. The storm became extratropical on November 8, and it was absorbed by a new center of circulation. The new, more powerful cyclone entered the Bering Sea, and intensified to become the most powerful storm to ever impact the region, with a minimum barometric pressure of 924 millibars (27.3 inches of mercury). This compares to the previous record of 925 mbar (27.3 inHg) from a storm on October 25, 1977. In association with the storm, there were winds exceeding hurricane-force with a wind gust of 97 miles per hour (156 km/h) recorded at Shemya, Alaska. The storm also produced waves as high as 45 feet (14 m), although waves were lesser on the Alaska coast.[22] The storm weakened as it moved westward, and it produced a "ripple" in the jet stream which allowed for a strong cold front to dive southward out of Canada into the United States, producing a cold wave.[3]
November cold wave[edit]
In early November, a cyclone in the Bering Sea entered Alaska, generating a ripple in the jet stream.[3] The coincident presence of high pressure over the western United States and low pressure over the southern and central United States enabled very cold air in Canada to travel southward.[3] Denver, Colorado experienced a record low temperature for November 13 when temperatures dropped to −14 °F (−26 °C), breaking the previous record of −3 °F (−19 °C) set in 1916, and Freeze Watches and Freeze Warnings were issued across the Deep South by the National Weather Service.[23] The cold wave was accompanied by multiple snow events as well. By November 10, Winter Storm Warnings and Winter Weather Advisories had been issued across most areas from the northern Rocky Mountains to the Great Lakes.[24] Michigan received snow totals as high as 36.1 inches (92 cm) through December 12 from a system associated with the early cold wave.[25] The storm also brought high winds; Snowbasin, Utah even received wind gusts of 84 miles per hour (135 km/h), and parts of several mountain states and Kansas, Missouri, and Oklahoma recorded gale-force winds.[25]
Mid-November winter storm[edit]
 | |
| Duration | November 13–21, 2014 |
|---|---|
| Lowest pressure | 961 mb (28.38 inHg) |
| Maximum snow | 88 in (220 cm) |
| Fatalities | 24 fatalities |
| Damage | $46 million (2014 USD) |
While the cold wave was still ongoing, a storm entered the northwestern United States transporting much warmer and moister air over shallow cold air near the surface. On November 13, Portland, Oregon recorded .1 to .25 inches (0.25 to 0.64 cm) accumulation of ice. Other areas in the state recorded additional ice accumulations and one area recorded 1 foot (0.30 m) of snow. By state, maximum snow totals as high as 33 inches (84 cm) were recorded near Ouray, Colorado, with six other states reporting totals of at least 1 foot (0.30 m). Several states in the Great Plain region received over 4 inches (10 cm) of snow, and Dallas–Fort Worth reported a trace of snow on November 16 for the first time in 117 years of records.[26] An Oklahoma Mesonet station in Boise City, Oklahoma recorded a high temperature of 15 °F (−9 °C) on December 12 only two days after recording a high temperature of 81 °F (27 °C).[2] Snow accumulations of 3 to 4 inches (8 to 10 cm) and greater occurred across western, northern, and central Oklahoma.[2] On November 13, a total of 0.1 inches (0.3 cm) of snow was recorded in Little Rock, Arkansas, the earliest accumulating snow measured in the area in over 20 years.[1] Gaylord, Michigan received a record amount of snow for any time of the year, with 29.6 inches (75 cm) from November 18–20. In Buffalo, New York, significant snowfall occurred during the November 17–21 period, with 88 inches (220 cm) of snow recorded.[4]
Thanksgiving Week nor'easter[edit]
 | |
| Duration | November 25–27, 2014 |
|---|---|
| Lowest pressure | 987 mb (29.15 inHg) |
| Maximum snow | 13 in (33 cm) |
| Fatalities | 0 fatalities |
| Damage | Unknown (2014 USD) |
In late November, around Thanksgiving, a nor'easter traveled up the East Coast, dropping up to a foot of snow in some areas, and causing major travel headaches for much of the country.[11] The storm originated from a stationary front that was situated off Florida late on November 25. The entire system was rain at this point. An area of low pressure formed around midnight November 26, and this low began to track up the East Coast. With cold air in place, snow began to break out in West Virginia, Pennsylvania, New Jersey, New York, all the way to Vermont, with the rain/snow line in central New Jersey. The winter storm ended up dropping up to 13 inches (33 cm) of snowfall in a swath extending up the Appalachian Mountains into Canada.[11] The storm moved out into the northern Atlantic Ocean by November 27. Due to the storm, over 4,500 flights were canceled and over 400,000 people were without power on November 27; southern New Hampshire was the worst hit, experiencing up to 200,000 outages, becoming the 4th largest power outage in state history.[27] The nor’easter was dubbed Winter Storm Cato by The Weather Channel. [11]
Early December nor'easter[edit]
 | |
| Duration | December 8–11, 2014 |
|---|---|
| Lowest pressure | 990 mb (29.23 inHg) |
| Maximum snow | 27.5 in (70 cm) |
| Fatalities | 0 fatalities |
| Damage | Unknown (2014 USD) |
On December 9, a strong nor'easter moved ashore over New England, bringing with it heavy rain, wind, some ice, and snow[28] in interior parts of the region, some which were battered hard by Hurricane Sandy more than 2 years prior. Developing from a stalled frontal boundary off the East Coast, it then moved up the coast late on December 8 and continued to intensify and then move inland on Long Island around noon December 9, before stalling for a day or so. Cold air coming in from the north resulted in the western side becoming snow. The system gradually moved to the east, before dissipating on December 11. Snowfall totals peaked at 27.5 inches (70 cm) from this system. The Nor’easter was Named Winter Storm Damon by the weather channel. [28] At JFK Airport, a daily record of 2.95 inches (7.5 cm) of rain was set.[29]
Mid-December storm complex[edit]
 | |
| Duration | December 9–18, 2014 |
|---|---|
| Lowest pressure | 960 mb (28.35 inHg) |
| Fatalities | 2 fatalities |
| Damage | Unknown (2014 USD) |
On December 9, 2014, ahead of a system moving onto the California coast, the National Weather Service issued several watches and warnings, including a Gale Warning, a Flash Flood Watch, a High Wind Watch, and a Hazardous Seas Advisory.[30] The storm complex brought heavy rain and snow to much of California. On hillsides scorched by wildfires, the rains brought down mud and rocks which covered part of California State Route 91.[31] The system brought from about 10 inches (25 cm) to over 2 feet (61 cm) of rain in some areas. High snowfall totals were recorded as well, with a maximum snowfall of 19.8 inches (50 cm) near Lodgepole, California. Recorded gusts of hurricane-force were recorded in California, Nevada, Oregon, and Washington, with a peak gust of 139 miles per hour (224 km/h) recorded near Benton, Nevada.[32] On December 12, an EF0-rated tornado struck Los Angeles. It was the most significant Los Angeles tornado since 1983, when a tornado struck the Los Angeles Convention Center.[33] While the rain was not great enough to bring an end to the intense drought affecting the area, it did help to bring some places above average in terms of annual precipitation.[31]
Early January winter storm & cold wave[edit]
On December 27, an arctic cold front swung into the Northwestern United States, bringing very cold temperatures behind it. An area of low pressure formed along this front, and was originally weak at first and produced moderate to heavy snowfall in the Northwest through December 28. As it approached the Southwest early on December 29, the low intensified somewhat as it neared the subtropical branch of the jet steam, and slowly began to draw moisture from the Pacific Ocean and the western half of the Gulf of Mexico. This resulted in snowfall totals of up to 2 feet (24 in) in the higher elevations, but also moderate to heavy snow in the lower elevations as well.[34] As cold air continued to filter in over warm air into the morning of December 30–31, freezing rain began to develop across the southwestern parts of Texas, with accumulations up to 15 millimetres (0.59 in).[34] The low began to coalesce into a winter storm in the first two days of 2015, as the low began to track to the northeast, its sights set on the Upper Midwest, Ohio Valley, and Northeast. On January 3, the winter storm began to develop thunderstorms along its cold front as it tracked into the Deep South, which was also a threat for tornadoes. The storm began to producing a swath of accumulating snow of anywhere from 2–7 inches (5.1–17.8 cm) into the Upper Midwest and Northeast.[34] A wintry mix and freezing rain was the majority of the precipitation in southwestern New England; however, areas to the south received rain. The storm system then gradually moved out into Canada by January 4. Sixteen people were killed due to the winter storm.[35]
While bringing a wide swath of wintry weather from coast to coast, the winter storm also brought along with it a cold wave, in which some places broke record low temperatures. On January 1, 2015, Los Angeles experienced a record low of 36 °F (2 °C), a temperature matched in Pasadena, where the Tournament of Roses Parade was not the coldest in history as forecasters had expected.[36][37]
On January 8, Estcourt Station, Maine was the coldest place in the United States with −38 °F (−39 °C). Montpelier, Vermont had a record low of −20 °F (−29 °C), and Jackson, Kentucky was −1 °F (−18 °C). Schools closed in Portland, Maine and Chicago. In New York City the temperature was 9 °F (−13 °C), with a wind chill of −2 °F (−19 °C). Even as far south as Mobile, the temperature reached 17 °F (−8 °C).[38] Nearly 2000 flights were delayed, and 500 cancelled. Washington, D.C. had delays when railroads froze. In Pittsburgh, two baby African penguins at the National Aviary had to go inside.[39]
Late January blizzard[edit]
  | |
| Duration | January 24–30, 2015 |
|---|---|
| Lowest pressure | 970 mb (28.64 inHg) |
| Maximum snow | 36 in (91 cm) |
| Fatalities | 3 fatalities |
| Damage | $500 million (2015 USD) |
On January 23, a low-pressure area developed off the Pacific Northwest,[40] before quickly moving over the Canadian Prairies by January 24. The storm system quickly moved southeastward into the Upper Midwest during the evening of January 24, taking a path typical of an Alberta clipper.[41][42] As it progressed southward, the storm intensified, with frontogenesis occurring the next day.[43] By noon on January 25, the upper-level low was centered near the border between Iowa and Missouri in correlation with a weak shortwave trough. Moisture from the Gulf of Mexico wrapped around the system from the south, resulting in widespread rainfall and snow over the Midwest.[44] Throughout the day, the system traversed eastward along the Kentucky-Tennessee border. Snowfall remained concentrated along a cold front north of the Ohio River.[45]
At 09:00 UTC on January 26, the Weather Prediction Center began issuing storm summaries on the developing disturbance while the low-pressure system was centered near Bluefield, West Virginia. At the time, mixed precipitation was occurring over northern Appalachia.[46][47] As this system tracked eastward, it gradually weakened;[48] however, at the same time, a new low pressure formed off the coast of North Carolina and began to track north-northeastward, eventually becoming the dominant low of the storm.[49] Early on January 30, the nor'easter left the East Coast, even as another winter storm began to impact the region.[50]
Late January–early February blizzard[edit]
 | |
| Duration | January 30 – February 2, 2015 |
|---|---|
| Lowest pressure | 970 mb (28.64 inHg) |
| Maximum snow | 24.1 in (61 cm) |
| Fatalities | 15 fatalities |
| Damage | Unknown (2015 USD) |

A major winter storm occurred from January 31 – February 2, bringing blizzard conditions to the Chicago area with 19.3 inches (49 cm) of snow, being the fifth-largest snowfall in city history. Detroit received 16.7 inches (42 cm), the third-largest recorded total and largest storm in 40 years.[51] Over a foot of snow was reported in locations in Indiana, Iowa, Ohio, and Wisconsin.[52] At least 25 centimetres (9.8 in) of snow fell near Toronto.[53] Some parts of the Northeast received up to two feet of snow from this storm, as a heavy band of snow stalled over Southern New England. However, widespread amounts of between 10 and 15 inches were much more the norm.[54]
Early February winter storm[edit]
| Duration | February 8–10, 2015 |
|---|---|
| Maximum snow | 22 in (56 cm) |
| Fatalities | 0 fatalities |
| Damage | Unknown (2015 USD) |
On February 8, Boston experienced its fourth winter storm in as many weeks, with 22 inches (56 cm) added to 37 inches (94 cm) already on the ground, the most ever. Already, the city had set a record snow amount for seven days. Boston had received 71.8 inches (182 cm) in a month, surpassing the previous record of 58.8 inches (149 cm) from February 1978. Governor of Massachusetts Charlie Baker declared a state of emergency, and MBTA subway and commuter rail trains were suspended on February 10. The Storm was Named Winter Storm Marcus by the weather channel. [55]
February cold wave[edit]
Throughout nearly the entire month of February, extreme cold plagued the eastern half of the nation. Multiple blasts of arctic air associated with the polar vortex dove into the Northeast, but the coldest was the shot of arctic air that brought the coldest air recorded over portions of the eastern Great Lakes in decades on February 15, and possibly over the entire forecast record.[56] Well below normal temperatures covered a large portion of the eastern United States and were expected to stay in place, with only slight moderation, through the rest of the month.[57] Through February 21, primarily on February 16 and February 20, over 600 record low temperatures were recorded in the eastern U.S., including all-time record lows and record lows for February.[58][19] As of February 15, Lake Erie had 94 percent ice cover[59] while Lake Superior and Lake Huron were over 80 percent covered, and Lakes Michigan and Ontario were between 50 and 60 percent iced over.[60]
Mid-February blizzard[edit]
 | |
| Duration | February 14–15, 2015 |
|---|---|
| Lowest pressure | 958 mb (28.29 inHg) |
| Maximum snow | 27.4 in (70 cm) |
| Fatalities | 6 fatalities |
| Damage | Unknown (2015 USD) |
From February 14–15, the Northeast experienced yet another winter storm, with Boston receiving over 12 inches (30 cm) of snow.[61] Other locations around Massachusetts received up to 22 inches (56 cm), bringing the total snowfall up to almost 6 feet (1.8 m) in some areas.[61] Residents of Boston and surrounding areas were urged to stay inside, due to the increasingly dangerous conditions.[61] There were numerous automobile accidents and roofs caving in throughout the Northeast and Midwest, and at least six people were confirmed dead.[62]
Parts of the central and southern U.S. received heavy snow and ice. Washington, D.C. received over 4 inches (10 cm) of snow and parts of the mid-South received 0.5 inches (1.3 cm) of freezing rain. The ice storm caused over 200,000 people to lose power.[63] A second winter storm hit the mid-South on February 25–26, bringing an additional 3 inches (7.6 cm) to 8 inches (20 cm) of snow much of North Carolina.[64]
Late February–early March winter storms[edit]
In the last week of February into the first week of March, four separate winter storms impacted areas from western Texas to the Northeast, all which included a messy swath of snow and ice.
The first winter storm occurred on the weekend of February 20–22. During this time period, a weak area of low pressure formed in the central parts of the U.S, and began to track eastward. Precipitation was at first relatively scattered, but as the day went on it began to blossom, reaching the Mid-Atlantic by the evening of February 21. There was more ice then snow in this system, and as a result, periods of freezing rain and sleet were expected in a swath extending from North Carolina to Long Island, with ice accumulations ranging from 0.1–0.5 inches (2.5–12.7 mm),[65] and snow accumulations of 5–8 inches (13–20 cm).[65] This system moved off the coast early on February 22.
The second winter storm focused on the South and Southeast on February 25–26. A stationary front coalesced into an area of low pressure in the center of Louisiana, and moved to the east. Originally composed of all rain, snow began to break out on the northern side of the winter storm due to cold air beginning to penetrate into the Deep South. It consisted of wet snow, which would cause numerous power outages.[66] Heavy snowbands also began to set up, which was the result of heavy accumulations ranging from 6–12 inches (15–30 cm) in eastern North Carolina.[64] The winter storm also produced a small but potent line of thunderstorms in the Florida Peninsula, as such a tornado watch was issued. The system began to accelerate somewhat as it began to emerge off the Southeast coast early on February 26, as snow continued to fall into the southern parts of the Mid-Atlantic.
The third in the series of winter storms happened from February 28 into late March 1, and spread a swath of snow and ice from the High Plains to New England.[67] The system organized from an upper-level impulse associated with a developing southward dip in the jet stream, which led to the formation of a weak area of low pressure. This weak disturbance began to develop a stripe of snow from the Midwest to the Ohio Valley, and it began to push into the Northeast as the sluggish winter storm tracked to the east. Snowfall was sometimes heavy at times, with snowfall rates of up to 2 inches per hour, but didn't last long. Freezing rain also began to develop in the Mid-Atlantic, setting the stage for more ice accumulations. As the snow moved to the east, warm air began to run over the cold air in place over the Mid-Atlantic, and snow changed over to a mix of freezing rain and sleet by evening on March 1 in areas near Maryland and southern New Jersey. Ice accumulations ranged from 0.1–0.4 inches (2.5–10.2 mm), and snow totals 5–8 inches (13–20 cm) in a swath from the Midwest near Illinois to southern New England. The entire wintry mess moved off by mid-morning on March 2.[68]
The fourth and final winter storm came right on the heels of the previous system, and actually occurred in two phases, with the latter bringing record cold in its wake.[69] It occurred from March 3–5, and brought up to a foot of snow in the Northeast, while also causing multiple travel issues and/or delays. One such included a pileup on Interstate 65 in Kentucky, where some people were stranded for many hours.
Early May storm complex[edit]
Another late season winter storm occurred on Mother's Day, and brought snowfall up to 2 feet (24 in) in areas around Denver, in pretty much the same spots and time that a winter storm impacted a year prior.[70] It first started spreading snow in the Sierra Mountains from May 6–9. Afterwards, it began to move northeastwards towards the High Plains. The snowstorm dumped up to 2 feet of snow in the mountains of Colorado and up to 12 inches in the lower elevations. The storm complex also produced flooding and several tornadoes in the Great Plains region, including multiple intense EF3 tornadoes.[71]
Records[edit]
Northeastern United States[edit]
Nine states in the Northeast United States had one of their coldest January–March periods on record.[72] According to the National Oceanic and Atmospheric Administration, from February 1 to 28, 2015, 898 lowest minimum temperature records were broken and 91 were tied in the Northeastern United States. In addition, 736 records for the highest snow depth were broken and 138 were tied during the same period.[73]
Over a large portion of New England, February 2015 was the most extreme winter month observed in modern record keeping. Eastport, Maine was one of many places also seeing record snowfall, with 132.5 inches (337 cm) over five weeks. Snowflakes fell on 19 out of 28 days in the Boston, Massachusetts area, setting records in numerous locations with depths up to over 36.0 inches (91 cm) deep in certain places. Boston broke the previous record for the snowiest month by almost 24.0 inches (61 cm).[74]
With a total of 108.6 inches (276 cm) as of March 16, Boston broke its previous all-time winter season (July 1 through June 30) record of 107.6 inches (273 cm) set in 1995–96.[75] Previously Boston saw a record 30-day snowfall of 94.4 inches (240 cm) from January 24 – February 22, 2015. Other broken records included four calendar days with at least 12.0 inches (30 cm) of snow, and the fastest 72.0 inches (183 cm) snowfall in 18 days from January 24 – February 10, 2015, and the fastest 90.0 inches (229 cm) snowfall during 23 days, from January 24 – February 15, 2015. Overall, Boston saw three of its top seven heaviest snowstorms in just over two years. Record cold temperatures were involved as Boston failed to reach 40 °F (4 °C) for 43 consecutive days, from January 20 through March 3.[citation needed] Boston also spent the second longest amount of time below freezing in the city records at 15 days.[76]
Providence, Rhode Island saw its second snowiest season with 73.5 inches (187 cm), with February being their second all-time snowiest month with 31.8 inches (81 cm).[77]
Boston, Massachusetts, received 99.4 inches (252 cm) of snow for the meteorological winter of 2014–15, which was 66.6 inches (169 cm) over the average, and broke the 1993–94 record of 81.5 inches (207 cm). Most of this snow was during February, which saw 64.8 inches (165 cm). For the year, Boston's record snow as of March 31 was 110.6 inches (281 cm).[citation needed] Despite Boston’s record snow in February, however, this was still the 40th driest February in Massachusetts.[78]
Baltimore (as measured at BWI), averaged below the freezing temperatures for first three months of 2015, making it the coldest start to any year there on record. January averaged 2.1 °F (1.2 °C) below normal, and February was the second-coldest on record, being 10.5 °F (5.8 °C) below normal, while March continued the chilly trend, finishing 3.9 °F (2.2 °C) below normal.[79]
In February 2015, nine states (Connecticut, Maine, Massachusetts, New Hampshire, New York, Ohio, Pennsylvania and Vermont) had their second coldest February.[80] New York and Vermont had its coldest first quarter on record in 2015.[81]
Western United States[edit]
Despite an intrusion of cold air near the end of the month, temperatures in the Western United States averaged above normal for December, with temperatures in much of the area averaging over 3 °F (1.6 °C) above normal. The greatest departures from normal occurred in the vicinity of southern Idaho, where temperatures in Pocatello averaged 32.2 °F (0.1 °C), the seventh-warmest December in the area's 72-year record. Salt Lake City, Utah observed a monthly average temperature of 37.3 °F (2.9 °C), 7 °F (3.8 °C) above average, making the month the third-warmest December on record for the city. Ontario, Oregon too experienced its third-warmest December on record, averaging 36.2 °F (2.3 °C), 8.4 °F (4.6 °C) above normal. Fresno, California observed its warmest December on record, with an average of 51.9 °F (11.1 °C). Mount Shasta experienced its second-warmest December on record, with an average temperature of 41.1 °F (5.1 °C), 6.0 °F (3.3 °C) above normal.[82]
California, Idaho, Nevada, Oregon, Utah, Washington, and Wyoming all experienced a top-10 warm January in 2015. California also experienced its fourth-driest January on record, receiving only 15 percent of its average precipitation for what would ordinarily be the wettest month of the year. San Francisco recorded no measurable precipitation in January for the first time on record, and as with the state, January is typically the wettest month of the year for the city.[83] As of March 27, 2015 snowpack in the Sierra Nevada was at a record low of eight percent of the historical average for April 1.[84] Winslow, Arizona recorded 1.11 in (28 mm) above the normal precipitation level for the month with 1.63 in (41 mm) of precipitation during the month of January. With 270 percent of the average monthly precipitation, Tucson, Arizona saw its fourth-wettest January in a 69-year record with 2.54 in (65 mm) of precipitation. With an average monthly temperature of 62 °F (16.7 °C) (4 °F (2.2 °C) above normal), Los Angeles experienced its sixth-warmest January in its 139-year record. Rock Springs, Wyoming saw its third-warmest January on record with an average temperature of 29 °F (−1.7 °C) for the month, 7.6 °F (4.2 °C) above the temperatures typically observed.[85]
Much of the Western United States, including Arizona, California, Nevada, Utah, and Washington, experienced its warmest winter on the 120-year record, and Idaho, Oregon, and Wyoming experienced one of their top-three warmest winters.[86]
Canada[edit]
Toronto, Ontario recorded its coldest month on record in February with −12.6 °C (9.3 °F) at Pearson Airport, tying with February 1875 (recorded in downtown) and beating the previous record of −12.4 °C (9.7 °F) set in January 1994.[87]
In Quebec, Montreal experienced its coldest February on record with an extended cold spell and an average temperature of −15 °C (5 °F).[88]
On February 13, Guelph, Ontario matched a 116-year-old record with a temperature of −20.02 °F (−28.90 °C).[89]
By the end of April 2015, a record 550 centimetres (220 in) of snow fell on parts of the Prince Edward Island.[90]
By the end of February, the maximum extent of ice cover in the Great Lakes was 88.8%, the first time since the late 1970s that two consecutive winters had resulted in ice cover of greater than 80%.[91]
Season effects[edit]
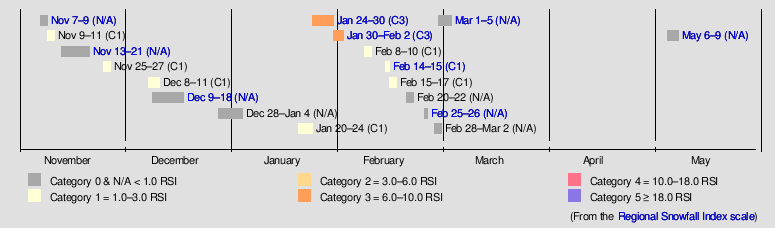
This is a table of all of the events that have occurred in the 2014–15 North American winter. It includes their duration, damage, impacted locations, and death totals. Deaths in parentheses are additional and indirect (an example of an indirect death would be a traffic accident), but were still related to that storm. All of the damage figures are in 2015 USD.
| Regional Snowfall Index scale | |||||
| C0 | C1 | C2 | C3 | C4 | C5 |
| Event name |
Dates active | RSI category | RSI value | Highest gust mph (km/h) |
Minimum pressure (mbar) |
Maximum snow in (cm) |
Maximum ice in (mm) |
Areas affected | Damage (2015 USD) |
Deaths |
|---|---|---|---|---|---|---|---|---|---|---|
| November Bering Sea cyclone | November 8 – 13 | N/A | N/A | 84 (135) | 920 | N/A | N/A | Bering Sea, Aleutian Islands, Russian Far East, Alaska, Contiguous United States | Unknown | None |
| Mid-November winter storm | November 13 – 21 | N/A | N/A | N/A | 961 | 88 (223) | N/A | Pacific Northwest, Central United States, Eastern United States, Northern Mexico, Eastern Canada, Southern Greenland, Iceland | $46 million | 24 |
| Thanksgiving Week nor'easter | November 25 – 27 | Category 1 | 1.756 | N/A | 987 | 13 (33) | N/A | Southeastern United States, Northeastern United States, New England, Atlantic Canada | Unknown | N/A |
| Early December nor'easter | December 8 – 11 | Category 1 | 1.881 | N/A | 990 | 27.5 (70) | N/A | Northeastern United States | Unknown | N/A |
| Mid-December storm complex | December 9 – 18 | N/A | N/A | 139 (224) | 960 | N/A | N/A | Continental United States, Southern Canada | Unknown | 2 |
| Late January blizzard | January 24 – 28 | Category 3 | 6.16 | 95 (153) | 970 | 36 (91) | N/A | Pacific Northwest, Central United States, Eastern United States, Atlantic Canada, Southern Greenland, Portugal, Spain, France | $500 million | 3 |
| Late January–early February blizzard | January 30 – February 2 | Category 3 | 8.40 | N/A | 978 | 24.1 (61) | 0.32 (8.1) | High Plains, Ohio Valley, Central United States, New England | Unknown | 15 |
| Early February winter storm | February 8 – 10 | Category 1 | 1.897 | N/A | N/A | 22 (56) | N/A | Northeastern United States, Canada | Unknown | N/A |
| Mid-February blizzard | February 14 – 15 | Category 1 | 1.14 | N/A | 958 | 27.4 (70) | N/A | Northeast United States, New England, Canada (partial) | Unknown | 6 |
| February 25–26 Southeast winter storm | February 25 – 26 | N/A | N/A | N/A | 985 | 12.7 (32) | 0.5 (13) | Southeastern United States (Texas, Louisiana, Mississippi, Alabama, Tennessee, Georgia), Northeast | Unknown | 4 |
| Early March winter storm | March 1 – 5 | N/A | N/A | N/A | 993 | 54.6 (139) | 0.25 (6.4) | Southwestern United States, High Plains, Upper Midwest, Southeastern United States, Northern Mexico, Northeastern United States | Unknown | 4 |
| Early May storm complex | May 6 – 9 | N/A | N/A | N/A | 985 | 24 (61) | N/A | Midwestern United States | Unknown | N/A |
| Season aggregates | ||||||||||
| 10 RSI storms | November 8 – May 9 | 920 | 88 (100) | 0.5 (13) | ≥ $546 million | 57 (44) | ||||
See also[edit]
- 2015 Texas–Oklahoma flood and tornado outbreak
- Early 2014 North American cold wave
- 2013–14 North American winter
- 2014 Pacific typhoon season
- 2015–16 North American winter
- Tornadoes of 2014
- Tornadoes of 2015
References[edit]
- ^ a b "Central Arkansas sees surprise November snowfall". Little Rock, Arkansas: KTHV. Associated Press. November 13, 2014. Archived from the original on February 22, 2015. Retrieved December 21, 2014.
- ^ a b c "November Snow Steals Show" (PHP). Norman, Oklahoma: Oklahoma Climatological Survey. December 2, 2014. Retrieved December 21, 2014.
- ^ a b c d e Howard, Brian Clark (November 19, 2014). "Why Is Record Cold and Epic Snow Hitting U.S. So Early?". National Geographic Society. Archived from the original on November 22, 2014. Retrieved December 21, 2014.
- ^ a b c Erdman, Jon (December 1, 2014). "November 2014 Shattered Cold and Snow Records For Some". The Weather Channel, LLC. Retrieved December 21, 2014.
- ^ a b Wiltgen, Nick (March 10, 2015). "Winter 2014-15 Was Nation's 19th Warmest Despite Bitterly Cold February in East". weather.com. The Weather Channel. Retrieved March 16, 2015.
- ^ "Boston Breaks Record Seasonal Snowfall". United States National Oceanic and Atmospheric Administration — National Weather Service, Boston, MA. March 15, 2015. Archived from the original on March 18, 2015. Retrieved March 16, 2015.
- ^ "Earth's Seasons: Equinoxes, Solstices, Perihelion, and Aphelion, 2000-2025" (PHP). Washington, D.C.: United States Naval Observatory. March 27, 2015. Archived from the original on August 31, 2015. Retrieved August 15, 2015.
- ^ "Meteorological vs. Astronomical Seasons". National Centers for Environmental Information. National Centers for Environmental Information (NOAA/NWS). Retrieved July 3, 2015.
- ^ "NOAA: Another warm winter likely for western U.S., South may see colder weather". National Oceanic and Atmospheric Administration. October 16, 2014. Retrieved December 21, 2014.
- ^ Monthly Temperature Forecasts (Period: December 2014 January-February 2015). Environment Canada (Report). Government of Canada. November 30, 2014.
- ^ a b c d e "Winter Storm Cato Recap: Rain, Snow Hampered Thanksgiving Travel". The Weather Channel. November 27, 2014. Retrieved April 8, 2016.
- ^ December 2014 National Climate Report, NOAA
- ^ December 2015 National Climate Report, NOAA
- ^ December 2021 National Climate Report, NOAA
- ^ December 2023 National Climate Report, NOAA
- ^ "Rain brings relief and fear to drought-stricken California". CBS News/Associated Press. Los Angeles, California: CBS Interactive Inc. December 2, 2014. Retrieved December 22, 2014.
- ^ Erdman, Jon; Wiltgen, Nick; Lam, Linda (December 17, 2014). "Recap: Storm Fueled By 'Pineapple Express' Brought Hurricane-Force Winds to California, Oregon, Washington". The Weather Channel, LLC. Retrieved December 22, 2014.
- ^ Martin, Cassie. "Falling Snow Records". eapsweb.mit.edu. Massachusetts Institute of Technology. Retrieved March 15, 2015.
- ^ a b Orr, Steve (February 26, 2015). "Rochester's coldest month. Ever". Democrat & Chronicle. Retrieved December 24, 2015.
- ^ Fritz, Angela. "U.S. runs hot and cold in record-shattering February". Washington Post. Retrieved March 14, 2015.
- ^ Harbarge, Molly (March 2, 2015). "5 things to know about the warmest winter, February in Portland and beyond". oregonlive.com. Retrieved March 15, 2015.
- ^ Lada, Brian (November 12, 2014). "Monster Storm Becomes Strongest on Record for Alaska". AccuWeather, Inc. Archived from the original on November 8, 2014. Retrieved December 22, 2014.
- ^ Rice, Doyle (November 13, 2014). "The big chill: Coast-to-coast cold strikes USA". USA Today. Gannett Satellite Information Network, Inc. Retrieved December 21, 2014.
- ^ Monarski, Allison Ann (November 10, 2014). Storm Summary Number 01 for Northern Rockies to Upper Great Lakes Early Season Winter Storm. Weather Prediction Center (Report). College Park, Maryland: National Oceanic and Atmospheric Administration. Retrieved December 22, 2014.
- ^ a b Krekeler, Jason A. (November 12, 2014). Storm Summary Number 10 for Northern Rockies to Upper Great Lakes Early Season Winter Storm. Weather Prediction Center (Report). College Park, Maryland: National Oceanic and Atmospheric Administration. Retrieved December 22, 2014.
- ^ Wiltgen, Nick; Erdman, Jon (November 17, 2014). "Winter Storm Bozeman Recap: Snow Blankets Northwest, Rockies, Plains, Midwest, Northeast". The Weather Channel, LLC. Retrieved December 22, 2014.
- ^ "Snow Storm" (PDF). weather.gov. November 26, 2014.
- ^ a b "Winter Storm Damon: Nor'easter Brought Snow, Heavy Rain, High Winds, Coastal Flooding (RECAP)". weather.com. December 11, 2014. Retrieved March 4, 2016.
- ^ Almasy, Steve (December 9, 2014). "Nor'easter brings record rain to New York – and West Coast, you're not off the hook". CNN. Retrieved July 4, 2022.
- ^ Mercer, Brandon (December 9, 2014). "Hurricane-Force Winds, Torrential Rain Forecast For What Could Be Storm Of The Decade". CBS SF Bay Area. San Francisco, California: CBS Local Media. Retrieved December 22, 2014.
- ^ a b "Southern California hit with intense series of storms". CBS News/Associated Press. Los Angeles, California: CBS Interactive Inc. December 17, 2014. Retrieved December 22, 2014.
- ^ Fanning, Amanda K.; Santorelli, A. (December 12, 2014). Storm Summary Number 07 for Powerful West Coast Storm. Weather Prediction Center (Report). College Park, Maryland: National Oceanic and Atmospheric Administration. Retrieved December 22, 2014.
- ^ Martinez, Michael; Botelho, Greg (December 14, 2014). "West Coast storms surprise Los Angeles with...a tornado, captured on video". Cable News Network. Los Angeles, California: Turner Broadcasting System, Inc. Retrieved December 22, 2014.
- ^ a b c "Winter Storm Frona Recap: Snow for the Midwest, Northeast". January 4, 2015. Retrieved April 15, 2016.
- ^ At Least 16 Deaths Blamed On Winter Storm Frona; Two Pedestrians Killed in Pennsylvania, The Weather Channel, January 7, 2015
- ^ Welch, Sara (January 1, 2015). "Southern California Cold Snap Breaks Record But Not at Rose Parade". KTLA. Retrieved January 9, 2015.
- ^ "126th Rose Parade could be coldest ever". Los Angeles Times. December 31, 2014. Retrieved January 9, 2015.
- ^ "Record-breaking weather: Mobile hits 17 degrees, beating 1886 temperature of 18". AL.com. January 8, 2015. Retrieved December 1, 2023.
- ^ Goldberg, Barbara (January 8, 2015). "Record-breaking cold closes U.S. schools, sends penguins inside". Reuters. Retrieved January 9, 2015.
- ^ "WPC Surface Analysis Archive: WPC surface analysis valid for 01/23/2015 at 21 UTC". Weather Prediction Center. College Park, Maryland: National Oceanic and Atmospheric Administration. January 23, 2015. Retrieved January 27, 2015.
- ^ Rubin-Oster, Brenden (January 24, 2015). "Short Range Public Discussion Jan 24 2015 335 AM EST". Weather Prediction Center. College Park, Maryland: United States National Weather Service. Archived from the original on January 26, 2015. Retrieved January 26, 2015.
- ^ Petersen, Daniel (January 23, 2015). "Probabilistic Heavy Snow And Icing Discussion Jan 23 2015 3:17AM EST". Weather Prediction Center. College Park, Maryland: National Oceanic and Atmospheric Administration. Archived from the original on February 3, 2015. Retrieved January 26, 2015.
- ^ Petersen, Daniel (January 24, 2015). "Probabilistic Heavy Snow And Icing Discussion Jan 24 2015 3:49AM EST". Weather Prediction Center. College Park, Maryland: National Oceanic and Atmospheric Administration. Archived from the original on February 3, 2015. Retrieved January 26, 2015.
- ^ Office of Satellite and Product Operation (January 25, 2015). "Satellite Precipitation Estimates Jan 25 2015 1545Z". National Environmental Satellite, Data, and Information Service. National Oceanic and Atmospheric Administration. Retrieved January 26, 2015.
- ^ Office of Satellite and Product Operation (January 25, 2015). "Satellite Precipitation Estimates Jan 25 2015 1945Z". National Environmental Satellite, Data, and Information Service. National Oceanic and Atmospheric Administration. Retrieved January 26, 2015.
- ^ Fanning, Amanda (January 26, 2015). "Storm Summary Number 01 For Mid-Atlantic To Northeast Major Winter Storm". Weather Prediction Center. College Park, Maryland: National Oceanic and Atmospheric Administration. Archived from the original on October 31, 2015. Retrieved January 26, 2015.
- ^ Office of Satellite and Product Operation (January 26, 2015). "Satellite Precipitation Estimates Jan 26 2015 0915Z". National Environmental Satellite, Data, and Information Service. National Oceanic and Atmospheric Administration. Retrieved January 26, 2015.
- ^ Petersen, Daniel (January 26, 2015). "Probabilistic Heavy Snow And Icing Discussion Jan 26 2015 4:07AM EST". Weather Prediction Center. College Park, Maryland: National Oceanic and Atmospheric Administration. Archived from the original on January 23, 2015. Retrieved January 26, 2015.
- ^ Kong, Kwan-yin (January 26, 2015). "Storm Summary Number 02 For Mid-Atlantic To Northeast Major Winter Storm". Weather Prediction Center. College Park, Maryland: National Oceanic and Atmospheric Administration. Archived from the original on October 31, 2015. Retrieved January 26, 2015.
- ^ "Winter Storm Kari Blankets Snow-Weary New England". The Weather Channel. January 29, 2015.
- ^ Erdman, Jon; Dolce, Chris (February 2, 2015). "Winter Storm Linus: Top 5 Snowstorm All-Time in Chicago, Detroit". The Weather Channel.
- ^ "Winter Storm Linus: How Much Snow Has Fallen?". The Weather Channel. February 2, 2015.
- ^ "Toronto storm: Dozens of collisions after snow blankets GTA". CTV. Toronto. February 2, 2015.
- ^ "Forecast". Weather.gov. February 2015. Archived from the original on February 3, 2015.
- ^ Bacon, John (February 10, 2015). "Snowstorm wallops Boston with 20 more inches; records fall". USA Today.
- ^ "Arctic Valentine's blast won't warm the heart". Business First. February 13, 2015. Retrieved February 13, 2015.
- ^ Paul, Don (February 5, 2015). Why it's so gosh darned cold and why it will stay that way for some time to come Archived September 7, 2015, at the Wayback Machine. WIVB-TV. Retrieved February 15, 2015.
- ^ "Siberian Express Grips Midwest, Northeast, South; Four Cities Set All-Time Record Lows". The Weather Channel. February 21, 2015. Retrieved February 21, 2015.
- ^ "Frozen Over: Lake Erie 94 Percent Covered in Ice". NBC News. February 15, 2015. Retrieved February 19, 2015.
- ^ Wagner, Meg (February 17, 2015). "See it: Great Lakes freeze over; Lake Erie nearly 100% covered in ice". New York Daily News. Retrieved February 19, 2015.
- ^ a b c Simone M. Scully and Michele Berge (February 15, 2015). "As Winter Storm Neptune Snowfall Wanes in Boston, Residents Still Urged Off Roads". Weather Channel. Retrieved February 15, 2015.
- ^ "Winter Storm Neptune Update: 6 Dead in Icy Crashes". The Weather Channel. February 15, 2015. Retrieved February 15, 2015.
- ^ Bacon, John (February 17, 2015). "Deadly snow, ice bring havoc to South, East".
- ^ a b "Snow, ice sweep across North Carolina". Associated Press. February 26, 2015.
- ^ a b "Winter Storm Pandora: Widespread Snow, Sleet and Freezing Rain in the East (RECAP)". The Weather Channel. February 19, 2015.
- ^ "News". The Weather Channel. February 25, 2015.
- ^ "Winter Storm Sparta Barrels Through Plains, Midwest and Northeast (PHOTOS)". The Weather Channel. March 1, 2015. Retrieved April 1, 2016.
- ^ "Winter Storm Sparta Brings Snow, Ice From Rockies to the Northeast (RECAP)". The Weather Channel. March 1, 2015. Retrieved April 1, 2016.
- ^ "Record-Breaking Cold: All-Time March Record Lows Set". The Weather Channel. March 7, 2015. Retrieved April 3, 2016.
- ^ "Winter Storm Venus Brings Heavy Snow to the Rockies and High Plains (RECAP)". May 11, 2015. Retrieved April 3, 2016.
- ^ "Large Tornadoes Ravage Small Towns in Texas, Arkansas, Iowa and South Dakota, Killing At Least 6". May 11, 2015. Retrieved April 3, 2016.
- ^ "Nine States in West, Northeast See Record January-March Temperature Extremes in 2015, Says NOAA Report". The Weather Channel. April 1, 2015. Retrieved July 29, 2015.
- ^ "Data Tools: Daily Weather Records". ncdc.noaa.gov. US gov. Retrieved March 3, 2015.
- ^ Fisher, Eric (February 27, 2015). "The Most Extreme Winter Month Ever Observed in New England?". boston.cbslocal.com. Retrieved March 10, 2015.
- ^ "Boston breaks 20-year snowfall record". wcvb.com. Hearst Stations Inc. March 16, 2015. Retrieved March 16, 2015.
- ^ The Most Extreme Winter Month Ever Observed in New England?, CBS News, February 27, 2015
- ^ Erdman, Jon. "New England Record Snow Tracker: One of Snowiest Seasons in Boston, Providence, Bangor". weather.com. Retrieved March 10, 2015.
- ^ Wiltgen, Nick (March 10, 2015). "Winter 2014-15 Was Nation's 19th Warmest Despite Bitterly Cold February in East". The Weather Channel. Retrieved January 28, 2023.
- ^ Dance, Scott. "One quarter through, 2015 off to coldest start on record". Retrieved April 1, 2015.
- ^ Record and Near-Record February Statewide Temperatures | February 2015 National Climate Report, NOAA
- ^ March 2015 National Climate Report, NOAA
- ^ State of the Climate: National Overview for December 2014. National Centers for Environmental Information (Report). Asheville, North Carolina: National Oceanic and Atmospheric Administration. February 2015. Retrieved October 24, 2015.
- ^ State of the Climate: National Summary Information for January 2015. National Climatic Data Center (Report). Asheville, North Carolina: National Oceanic and Atmospheric Administration. February 2015. Retrieved April 2, 2015.
- ^ Fimrite, Peter (March 28, 2015). "California drought: Sierra Nevada snowpack hits historic low". Retrieved March 29, 2015.
8 percent of the historical average for this time of year
- ^ State of the Climate: National Overview for January 2015. National Climatic Data Center (Report). Asheville, North Carolina: National Oceanic and Atmospheric Administration. February 11, 2015. Retrieved April 2, 2015.
- ^ "winter"-alaska ""Winter" in Alaska". Climate.gov. National Oceanic and Atmospheric Administration. March 18, 2015. Retrieved March 24, 2015.
- ^ "It's official: February was Toronto's coldest month ever". The Toronto Star. March 1, 2015. Retrieved July 19, 2018.
- ^ "Montreal records coldest February in history". March 1, 2015. Retrieved July 29, 2015.
- ^ "Ontario city matches 116-year-old record for coldest February 13". CTVNews.ca. February 13, 2015. Retrieved March 12, 2015.
- ^ Maritime winter of 2015 remembered in new book, Deep Freeze, CBC News, October 21, 2015
- ^ Quarterly Climate Impacts and Outlook: Great Lakes Region (PDF) (Report). Environment Canada. March 2015. Retrieved August 15, 2015.
External links[edit]
- 2014 Storm Summaries from the Weather Prediction Center
- 2015 Storm Summaries from the Weather Prediction Center