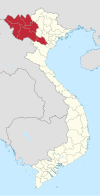
Mai Sơn District
Huyện Mai Sơn | |
|---|---|
 Interactive map outlining Mai Sơn District | |
| Coordinates: 21°11′56″N 104°6′0″E / 21.19889°N 104.10000°E | |
| Country | |
| Region | Northwest |
| Province | Sơn La |
| Capital | Hát Lót |
| Subdivision | one township and 21 rural communes |
| Government | |
| • Type | District |
| Area | |
| • Total | 1,410 km2 (540 sq mi) |
| Population (2019)[1] | |
| • Total | 163,881 |
| • Density | 120/km2 (300/sq mi) |
| Time zone | UTC+7 (UTC + 7) |
| Website | maison |
Mai Sơn is a rural district of Sơn La province in the Northwest region of Vietnam. As of 2019, the district had a population of 163,881.[1] The district covers an area of 1,410 km². The district capital lies at Hát Lót.[2]
Administrative divisions[edit]
Mai Sơn is divided into 22 commune-level sub-divisions, including the township of Hát Lót and 21 rural communes (Chiềng Ban, Chiềng Chăn, Chiềng Chung, Chiềng Dong, Chiềng Kheo, Chiềng Lương, Chiềng Mai, Chiềng Mung, Chiềng Nơi, Chiềng Sung, Chiềng Ve, Cò Nòi, Hát Lót, Mường Bằng, Mường Bon, Mường Chanh, Nà Bó, Nà Ớt, Phiêng Cằm, Phiêng Pằn, Tà Hộc).
Climate[edit]
| Climate data for Cò Nòi, Mai Sơn District | |||||||||||||
|---|---|---|---|---|---|---|---|---|---|---|---|---|---|
| Month | Jan | Feb | Mar | Apr | May | Jun | Jul | Aug | Sep | Oct | Nov | Dec | Year |
| Record high °C (°F) | 31.8 (89.2) |
34.4 (93.9) |
36.4 (97.5) |
37.9 (100.2) |
38.0 (100.4) |
36.8 (98.2) |
35.6 (96.1) |
34.6 (94.3) |
34.0 (93.2) |
32.9 (91.2) |
32.0 (89.6) |
31.4 (88.5) |
38.0 (100.4) |
| Mean daily maximum °C (°F) | 20.7 (69.3) |
23.2 (73.8) |
26.9 (80.4) |
29.8 (85.6) |
30.5 (86.9) |
30.0 (86.0) |
29.6 (85.3) |
29.4 (84.9) |
28.7 (83.7) |
26.7 (80.1) |
24.0 (75.2) |
21.2 (70.2) |
26.7 (80.1) |
| Daily mean °C (°F) | 14.6 (58.3) |
16.6 (61.9) |
20.1 (68.2) |
23.2 (73.8) |
24.7 (76.5) |
25.1 (77.2) |
24.9 (76.8) |
24.5 (76.1) |
23.6 (74.5) |
21.4 (70.5) |
18.1 (64.6) |
14.9 (58.8) |
21.0 (69.8) |
| Mean daily minimum °C (°F) | 10.6 (51.1) |
12.4 (54.3) |
15.6 (60.1) |
18.8 (65.8) |
20.8 (69.4) |
22.0 (71.6) |
21.9 (71.4) |
21.5 (70.7) |
20.1 (68.2) |
17.6 (63.7) |
14.0 (57.2) |
10.5 (50.9) |
17.2 (63.0) |
| Record low °C (°F) | −4.7 (23.5) |
1.9 (35.4) |
3.4 (38.1) |
8.5 (47.3) |
12.9 (55.2) |
13.6 (56.5) |
16.7 (62.1) |
16.2 (61.2) |
11.0 (51.8) |
5.4 (41.7) |
0.5 (32.9) |
−4.5 (23.9) |
−4.7 (23.5) |
| Average precipitation mm (inches) | 21.0 (0.83) |
19.8 (0.78) |
42.5 (1.67) |
113.0 (4.45) |
171.3 (6.74) |
217.6 (8.57) |
242.7 (9.56) |
243.2 (9.57) |
128.8 (5.07) |
51.7 (2.04) |
25.3 (1.00) |
16.1 (0.63) |
1,292.9 (50.90) |
| Average rainy days | 3.5 | 3.4 | 5.9 | 12.1 | 16.7 | 17.6 | 21.1 | 20.1 | 12.5 | 7.6 | 4.5 | 2.9 | 127.7 |
| Average relative humidity (%) | 78.4 | 75.5 | 72.4 | 74.0 | 76.8 | 82.8 | 85.5 | 86.0 | 83.7 | 81.3 | 79.6 | 78.4 | 79.6 |
| Mean monthly sunshine hours | 151.3 | 152.3 | 173.1 | 197.5 | 208.8 | 157.6 | 163.8 | 168.2 | 182.3 | 179.8 | 170.0 | 171.3 | 2,070.6 |
| Source: Vietnam Institute for Building Science and Technology[3] | |||||||||||||
References[edit]
- ^ a b General Statistics Office of Vietnam (2019). "Completed Results of the 2019 Viet Nam Population and Housing Census" (PDF). Statistical Publishing House (Vietnam). ISBN 978-604-75-1532-5.
- ^ "Districts of Vietnam". Statoids. Retrieved March 13, 2009.
- ^ "Vietnam Institute for Building Science and Technology" (PDF). Retrieved 16 August 2023.
