Photo-activated localization microscopy (PALM or FPALM)[1][2] and stochastic optical reconstruction microscopy (STORM)[3] are widefield (as opposed to point scanning techniques such as laser scanning confocal microscopy) fluorescence microscopy imaging methods that allow obtaining images with a resolution beyond the diffraction limit. The methods were proposed in 2006 in the wake of a general emergence of optical super-resolution microscopy methods, and were featured as Methods of the Year for 2008 by the Nature Methods journal.[4] The development of PALM as a targeted biophysical imaging method was largely prompted by the discovery of new species and the engineering of mutants of fluorescent proteins displaying a controllable photochromism, such as photo-activatible GFP. However, the concomitant development of STORM, sharing the same fundamental principle, originally made use of paired cyanine dyes. One molecule of the pair (called activator), when excited near its absorption maximum, serves to reactivate the other molecule (called reporter) to the fluorescent state.
A growing number of dyes are used for PALM, STORM and related techniques, both organic fluorophores and fluorescent proteins. Some are compatible with live cell imaging, others allow faster acquisition or denser labeling. The choice of a particular fluorophore ultimately depends on the application and on its underlying photophysical properties.[5]
Both techniques have undergone significant technical developments,[6] in particular allowing multicolor imaging and the extension to three dimensions, with the best current axial resolution of 10 nm in the third dimension obtained using an interferometric approach with two opposing objectives collecting the fluorescence from the sample.[7]
Principle[edit]
Conventional fluorescence microscopy is performed by selectively staining the sample with fluorescent molecules, either linked to antibodies as in immunohistochemistry or using fluorescent proteins genetically fused to the genes of interest. Typically, the more concentrated the fluorophores, the better the contrast of the fluorescence image.
A single fluorophore can be visualized under a microscope (or even under the naked eye[8]) if the number of photons emitted is sufficiently high, and in contrast the background is low enough. The two dimensional image of a point source observed under a microscope is an extended spot, corresponding to the Airy disk (a section of the point spread function) of the imaging system. The ability to identify as two individual entities two closely spaced fluorophores is limited by the diffraction of light. This is quantified by Abbe’s criterion, stating that the minimal distance that allows resolving two point sources is given by


where is the wavelength of the fluorescent emission and NA is the numerical aperture of the microscope. The theoretical resolution limit at the shortest practical excitation wavelength is around 150 nm in the lateral dimension and approaching 400 nm in the axial dimension (if using an objective having a numerical aperture of 1.40 and the excitation wavelength is 400 nm).

However, if the emission from the two neighboring fluorescent molecules is made distinguishable, i.e. the photons coming from each of the two can be identified, then it is possible to overcome the diffraction limit.[9] Once a set of photons from a specific molecule is collected, it forms a diffraction-limited spot in the image plane of the microscope. The center of this spot can be found by fitting the observed emission profile to a known geometrical function, typically a Gaussian function in two dimensions. The error that is made in localizing the center of a point emitter scales to a first approximation as the inverse square root of the number of emitted photons, and if enough photons are collected it is easy to obtain a localization error much smaller than the original point spread function.

The two steps of identification and localization of individual fluorescent molecules in a dense environment where many are present are at the basis of PALM, STORM and their development.
Although many approaches to molecular identification exist, the light-induced photochromism of selected fluorophores developed as the most promising approach to distinguish neighboring molecules by separating their fluorescent emission in time. By turning on stochastically sparse subsets of fluorophores with light of a specific wavelength, individual molecules can then be excited and imaged according to their spectra. To avoid the accumulation of active fluorophores in the sample, which would eventually degrade back to a diffraction-limited image, the spontaneously occurring phenomenon of photobleaching is exploited in PALM, whereas reversible switching between a fluorescent on-state and a dark off-state of a dye is exploited in STORM.
In summary, PALM and STORM are based on collecting under a fluorescent microscope a large number of images each containing just a few active isolated fluorophores. The imaging sequence allows for the many emission cycles necessary to stochastically activate each fluorophore from a non-emissive (or less emissive) state to a bright state, and back to a non-emissive or bleached state. During each cycle, the density of activated molecules is kept low enough that the molecular images of individual fluorophores do not typically overlap.


Localization of individual fluorophores[edit]
In each image of the sequence, the position of a fluorophore is calculated with a precision typically greater than the diffraction limit - in the typical range of a few to tens of nm - and the resulting information of the position of the centers of all the localized molecules is used to build up the super-resolution PALM or STORM image.
The localization precision can be calculated according to the formula:


where N is the number of collected photons, a is the pixel size of the imaging detector, is the average background signal and is the standard deviation of the point spread function.[10] The requirement of localizing at the same time multiple fluorophores simultaneously over an extended area determines the reason why these methods are wide-field, employing as a detector a CCD, EMCCD or a CMOS camera.


The requirement for an enhanced signal-to-noise ratio to maximize localization precision determines the frequent combination of this concept with widefield fluorescent microscopes allowing optical sectioning, such as total internal reflection fluorescence microscopes (TIRF) and light sheet fluorescence microscopes.
Super-resolution image[edit]
The resolution of the final image is limited by the precision of each localization and the number of localizations, instead of by diffraction. The super resolution image is therefore a pointillistic representation of the coordinates of all the localized molecules. The super resolution image is commonly rendered by representing each molecule in the image plane as a two dimensional Gaussian with amplitude proportional to the number of photons collected, and the standard deviation depending on the localization precision.

Applications[edit]
Multicolor PALM/STORM[edit]

The peculiar photophysical properties of the fluorophores employed in PALM/STORM super resolution imaging pose both constraints and opportunities for multicolor imaging. Three strategies have emerged so far: excitation of spectrally separated fluorophores using an emission beamsplitter,[12] using of multiple activators/reporters in STORM mode[13][14] and ratiometric imaging of spectrally close fluorophores.[15]
3D in PALM and STORM[edit]
Although originally developed as 2D (x,y) imaging methods, PALM and STORM have quickly developed into 3D (x,y,z) capable techniques. To determine the axial position of a single fluorophore in the sample the following approaches are currently being used: modification of the point spread function to introduce z-dependent features in the 2D (x,y) image (the most common approach is to introduce astigmatism in the PSF); multiplane detection, where the axial position is determined by comparing two images of the same PSF defocused one with respect to the other; interferometric determination of the axial position of the emitter using two opposed objectives and multiple detectors;[7] use of temporal focusing to confine the excitation/activation; use of light sheet excitation/activation to confine to a few hundred nanometers thick layer arbitrarily positioned along the z-plane within the sample.
Live cell imaging[edit]
The requirement for multiple cycles of activation, excitation and de-activation/bleaching would typically imply extended periods of time to form a PALM/STORM image, and therefore operation on a fixed sample. A number of works have been published as early as 2007[16] performing PALM/STORM on live cells. The ability to perform live super-resolution imaging using these techniques ultimately depends on the technical limitations of collecting enough photons from a single emitter in a very short time. This depends both on the photophysical limitations of the probe as well as on the sensitivity of the detector employed. Relatively slow (seconds to tens of seconds) processes such as modification in the organization of focal adhesions have been investigated by means of PALM,[17] whereas STORM has allowed imaging of faster processes such as membrane diffusion of clathrin coated pits or mitochondrial fission/fusion processes. A promising application of live cell PALM is the use of photoactivation to perform high-density single-particle tracking (sptPALM[18]), overcoming the traditional limitation of single particle tracking to work with systems displaying a very low concentration of fluorophores.
Nanophotonic interactions[edit]
While traditional PALM and STORM measurements are used to determine the physical structure of a sample, with the intensities of fluorescent events determining the certainty of the localization, these intensities can also be used to map fluorophore interactions with nanophotonic structures. This has been performed on both metallic (plasmonic) structures, such as gold nanorods,[19][20] as well as semiconducting structures, such as silicon nanowires.[21] These approaches can either be used for fluorophores functionalized on the surface of the sample of interest (as for the plasmonic particle studies mentioned here), or randomly adsorbed onto the substrate surrounding the sample, allowing full 2D mapping of fluorophore-nanostructure interactions at all positions relative to the structure.[21]
These studies have found that, in addition to the standard uncertainty of localization due to the point spread function fitting, self-interference with light scattered by nanoparticles can lead to distortions or displacements of the imaged point spread functions,[20][21] complicating the analysis of such measurements. These may be possible to limit, however, for example by incorporating metasurface masks which control the angular distribution of light permitted into the measurement system.[22]
Differences from STORM[edit]
PALM and STORM share a common fundamental principle, and numerous developments have tended to make the two techniques even more intertwined. Still, they differ in several technical details and a fundamental point. On the technical side, PALM is performed on a biological specimen using fluorophores expressed exogenously in the form of genetic fusion constructs to a photoactivatable fluorescent protein. STORM instead uses immunolabeling of endogenous molecules in the sample with antibodies tagged with organic fluorophores. In both cases the fluorophores are driven between an active-ON and an inactive-OFF state by light. In PALM, however, photoactivation and photobleaching confine the life of the fluorophore to a limited interval of time, and a continuous emission of the fluorophore is desirable in between without any fluorescence intermittency. In STORM stochastic photoblinking of the organic fluorophores (typically brighter than fluorescent proteins) was originally exploited to separate neighboring dyes. In this respect, the more robust the blinking, the higher the probability of distinguishing two neighbouring fluorophores.
In this respect, several research works have explored the potential of PALM to perform a quantitation of the number of fluorophores (and therefore proteins of interest) present in a sample by counting the activated fluorophores.[11][23][24] The approach used to treat the fluorescent dynamics of the fluorescent label used in the experiments will determine the final appearance of the super-resolution image, and the possibility of determining an unambiguous correspondence between a localization event and a protein in the sample.
Multimedia[edit]
-
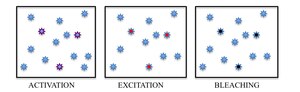
Immobilized fluorescent proteins being photoactivated, excited and bleached
-
Super resolution dynamic imaging of dendritic spines using a low affinity photoconvertible actin[25]
-
Investigating sub spine actin dynamics in rat hippocampal neurons with super resolution optical microscopy[26]
References[edit]
- ^ E. Betzig; G. H. Patterson; R. Sougrat; O. W. Lindwasser; S. Olenych; J. S. Bonifacino; M. W. Davidson; J. Lippincott-Schwartz; H. F. Hess (2006). "Imaging Intracellular Fluorescent Proteins at Nanometer Resolution". Science. 313 (5793): 1642–1645. Bibcode:2006Sci...313.1642B. doi:10.1126/science.1127344. PMID 16902090.
- ^ S. T. Hess; T. P. Giriajan; M. D. Mason (2006). "Ultra-high resolution imaging by Fluorescence Photoactivation Localization Microscopy". Biophysical Journal. 91 (11): 4258–4272. Bibcode:2006BpJ....91.4258H. doi:10.1529/biophysj.106.091116. PMC 1635685. PMID 16980368.
- ^ M. J. Rust; M. Bates; X. Zhuang (2006). "Sub diffraction-limit imaging by stochastic optical reconstruction microscopy (STORM)". Nature Methods. 3 (20): 793–796. doi:10.1038/nmeth929. PMC 2700296. PMID 16896339.
- ^ "Method of the Year 2008". Nature Methods. 6 (1): 1–109. 2009. doi:10.1038/nmeth.f.244.
- ^ Ha, Taekjip & Tinnefeld, Philip (2012). "Photophysics of Fluorescent Probes for Single-Molecule Biophysics and Super-Resolution Imaging". Annual Review of Physical Chemistry. 63 (1): 595–617. Bibcode:2012ARPC...63..595H. doi:10.1146/annurev-physchem-032210-103340. PMC 3736144. PMID 22404588.
- ^ Bo Huang and Hazen Babcock and Xiaowei Zhuang (2010). "Breaking the Diffraction Barrier: Super-Resolution Imaging of Cells". Cell. 143 (7): 1047–58. doi:10.1016/j.cell.2010.12.002. PMC 3272504. PMID 21168201.
- ^ a b Shtengel, Gleb and Galbraith, James A. and Galbraith, Catherine G. and Lippincott-Schwartz, Jennifer and Gillette, Jennifer M. and Manley, Suliana and Sougrat, Rachid and Waterman, Clare M. and Kanchanawong, Pakorn and Davidson, Michael W. and Fetter, Richard D. and Hess, Harald F. (2009). "Interferometric fluorescent super-resolution microscopy resolves 3D cellular ultrastructure". Proceedings of the National Academy of Sciences. 106 (9): 3125–3130. Bibcode:2009PNAS..106.3125S. doi:10.1073/pnas.0813131106. PMC 2637278. PMID 19202073.
{{cite journal}}: CS1 maint: multiple names: authors list (link) - ^ W. E. Moerner; D. P. Fromm (2003). "Methods of single-molecule fluorescence spectroscopy and individual fluorescence probes". Review of Scientific Instruments. 74 (8): 3597–3619. Bibcode:2003RScI...74.3597M. doi:10.1063/1.1589587. S2CID 11615310.
- ^ E. Betzig (1995). "Proposed Method for molecular optical imaging". Optics Letters. 20 (3): 237–239. Bibcode:1995OptL...20..237B. doi:10.1364/OL.20.000237. PMID 19859146.
- ^ K. I. Mortensen; L S. Churchman; J. A. Spudich; H. Flyvbjerg (2010). "Optimized localization analysis for single-molecule tracking and super-resolution microscopy". Nature Methods. 7 (5): 377–381. doi:10.1038/nmeth.1447. PMC 3127582. PMID 20364147.
- ^ a b Greenfield D, McEvoy AL, Shroff H, Crooks GE, Wingreen NS, et al. (2009). "Self-Organization of the Escherichia coli Chemotaxis Network Imaged with Super-Resolution Light Microscopy". PLOS Biology. 7 (6): e1000137. doi:10.1371/journal.pbio.1000137. PMC 2691949. PMID 19547746.
- ^ Shroff H, Galbraith CG, Galbraith JA, White H, Gillette J, Olenych S, Davidson MW, Betzig E (2007). "Dual-color superresolution imaging of genetically expressed probes within individual adhesion complexes". Proceedings of the National Academy of Sciences. 104 (51): 20308–20313. Bibcode:2007PNAS..10420308S. doi:10.1073/pnas.0710517105. PMC 2154427. PMID 18077327.
- ^ M Bates; B Huang; GT Dempsey; X Zhuang (2007). "Multicolor Super Resolution Imaging with Photo-Switchable fluorescent probes". Science. 317 (5845): 1749–1753. Bibcode:2007Sci...317.1749B. doi:10.1126/science.1146598. PMC 2633025. PMID 17702910.
- ^ Bock, H.; et al. (2007). "Two-color far-field fluorescence nanoscopy based on photoswitchable emitters". Applied Physics B. 88 (2): 161–165. Bibcode:2007ApPhB..88..161B. doi:10.1007/s00340-007-2729-0. S2CID 122146697.
- ^ Testa I, Wurm CA, Medda R, Rothermel E, von Middendorf C, Folling J, Jakobs S, Schonle A, Hell SW, Eggeling C (2010). "Multicolor fluorescence nanoscopy in fixed and living cells by exciting conventional fluorophores with a single wavelength". Biophysical Journal. 99 (8): 2686–2694. Bibcode:2010BpJ....99.2686T. doi:10.1016/j.bpj.2010.08.012. PMC 2956215. PMID 20959110.
- ^ Hess, Samuel T. and Gould, Travis J. and Gudheti, Manasa V. and Maas, Sarah A. and Mills, Kevin D. and Zimmerberg, Joshua (2007). "Dynamic clustered distribution of hemagglutinin resolved at 40 nm in living cell membranes discriminates between raft theories". Proceedings of the National Academy of Sciences. 104 (44): 17370–17375. Bibcode:2007PNAS..10417370H. doi:10.1073/pnas.0708066104. PMC 2077263. PMID 17959773.
{{cite journal}}: CS1 maint: multiple names: authors list (link) - ^ Shroff, H., C. G. Galbraith, J. A. Galbraith, and E. Betzig (2008). "Live-cell photoactivated localization microscopy of nanoscale adhesion dynamics". Nature Methods. 5 (44): 417–423. doi:10.1038/nmeth.1202. PMC 5225950. PMID 18408726.
{{cite journal}}: CS1 maint: multiple names: authors list (link) - ^ S Manley; J M Gillette; G H Patterson; H Shroff; H F Hess; E Betzig; J Lippincott-Schwartz (2008). "High-density mapping of single-molecule trajectories with photoactivated localization microscopy". Nature Methods. 5 (2): 155–157. doi:10.1038/nmeth.1176. PMID 18193054. S2CID 1101468.
- ^ Zhou, Xiaochun; Andoy, Nesha May; Liu, Guokun; Choudhary, Eric; Han, Kyu-Sung; Shen, Hao; Chen, Peng (2012). "Quantitative super-resolution imaging uncovers reactivity patterns on single nanocatalysts". Nature Nanotechnology. 7 (4): 237–241. Bibcode:2012NatNa...7..237Z. doi:10.1038/nnano.2012.18. ISSN 1748-3387. PMID 22343380. S2CID 4654704.
- ^ a b Lin, Hongzhen; Centeno, Silvia P.; Su, Liang; Kenens, Bart; Rocha, Susana; Sliwa, Michel; Hofkens, Johan; Uji-i, Hiroshi (2012). "Mapping of Surface-Enhanced Fluorescence on Metal Nanoparticles using Super-Resolution Photoactivation Localization Microscopy". ChemPhysChem. 13 (4): 973–981. doi:10.1002/cphc.201100743. ISSN 1439-4235. PMID 22183928.
- ^ a b c Johlin, Eric; Solari, Jacopo; Mann, Sander A.; Wang, Jia; Shimizu, Thomas S.; Garnett, Erik C. (2016). "Super-resolution imaging of light–matter interactions near single semiconductor nanowires". Nature Communications. 7: 13950. Bibcode:2016NatCo...713950J. doi:10.1038/ncomms13950. ISSN 2041-1723. PMC 5187462. PMID 27996010.
- ^ Backlund, Mikael P.; Arbabi, Amir; Petrov, Petar N.; Arbabi, Ehsan; Saurabh, Saumya; Faraon, Andrei; Moerner, W. E. (2016). "Removing orientation-induced localization biases in single-molecule microscopy using a broadband metasurface mask" (PDF). Nature Photonics. 10 (7): 459–462. Bibcode:2016NaPho..10..459B. doi:10.1038/nphoton.2016.93. ISSN 1749-4885. PMC 5001689. PMID 27574529.
- ^ P Annibale; S Vanni; M Scarselli; U Rothlisberger; A Radenovic (2011). "Quantitative Photo Activated Localization Microscopy: Unraveling the Effects of Photoblinking". PLOS ONE. 6 (7): p.e22678, 07. Bibcode:2011PLoSO...622678A. doi:10.1371/journal.pone.0022678. PMC 3144238. PMID 21818365.
- ^ Lee, Sang-Hyuk and Shin, Jae Yen and Lee, Antony and Bustamante, Carlos (2012). "Counting single photoactivatable fluorescent molecules by photoactivated localization microscopy (PALM)". Proceedings of the National Academy of Sciences. 109 (43): 17436–17441. Bibcode:2012PNAS..10917436L. doi:10.1073/pnas.1215175109. PMC 3491528. PMID 23045631.
{{cite journal}}: CS1 maint: multiple names: authors list (link) - ^ Izeddin I, Specht CG, Lelek M, Darzacq X, Triller A, et al. (2011). "Super-Resolution Dynamic Imaging of Dendritic Spines Using a Low-Affinity Photoconvertible Actin Probe". PLOS ONE. 6 (1): e15611. Bibcode:2011PLoSO...615611I. doi:10.1371/journal.pone.0015611. PMC 3022016. PMID 21264214.
- ^ Tatavarty V, Kim E, Rodionov V, Yu J (2009). "Investigating Sub-Spine Actin Dynamics in Rat Hippocampal Neurons with Super-Resolution Optical Imaging". PLOS ONE. 4 (11): e7724. Bibcode:2009PLoSO...4.7724T. doi:10.1371/journal.pone.0007724. PMC 2771285. PMID 19898630.
External links[edit]
- Superresolution Microscopy within Zeiss educational page in Microscopy and Digital Imaging
- Fundamental Concepts in Super Resolution within Nikon educational resources for Microscopy Education
- Eric Betzig and Harald Hess talk: Developing PALM Microscopy
- Xiaowei Zhuang talk: Super-Resolution Microscopy Archived 2015-03-24 at the Wayback Machine
- Light Microscopy: An ongoing contemporary revolution (Introductory Review)
| Illumination and contrast methods |
|  |
|---|---|---|
| Fluorescence methods | ||
| Sub-diffraction limit techniques | ||