

A pH indicator is a halochromic chemical compound added in small amounts to a solution so the pH (acidity or basicity) of the solution can be determined visually or spectroscopically by changes in absorption and/or emission properties.[1] Hence, a pH indicator is a chemical detector for hydronium ions (H3O+) or hydrogen ions (H+) in the Arrhenius model.
Normally, the indicator causes the color of the solution to change depending on the pH. Indicators can also show change in other physical properties; for example, olfactory indicators show change in their odor. The pH value of a neutral solution is 7.0 at 25°C (standard laboratory conditions). Solutions with a pH value below 7.0 are considered acidic and solutions with pH value above 7.0 are basic. Since most naturally occurring organic compounds are weak electrolytes, such as carboxylic acids and amines, pH indicators find many applications in biology and analytical chemistry. Moreover, pH indicators form one of the three main types of indicator compounds used in chemical analysis. For the quantitative analysis of metal cations, the use of complexometric indicators is preferred,[2][3] whereas the third compound class, the redox indicators, are used in redox titrations (titrations involving one or more redox reactions as the basis of chemical analysis).
Theory[edit]
In and of themselves, pH indicators are usually weak acids or weak bases. The general reaction scheme of acidic pH indicators in aqueous solutions can be formulated as:
- HInd(aq) + H
2O(l) ⇌ H
3O+(aq) + Ind−(aq)
where, "HInd" is the acidic form and "Ind−" is the conjugate base of the indicator.
Vice versa for basic pH indicators in aqueous solutions:
- IndOH(aq) + H
2O(l) ⇌ H
2O(l) + Ind+(aq) + OH−(aq)
where "IndOH" stands for the basic form and "Ind+" for the conjugate acid of the indicator.
The ratio of concentration of conjugate acid/base to concentration of the acidic/basic indicator determines the pH (or pOH) of the solution and connects the color to the pH (or pOH) value. For pH indicators that are weak electrolytes, the Henderson–Hasselbalch equation can be written as:
- pH = pKa + log10 [Ind−] / [HInd]
- pOH = pKb + log10 [Ind+] / [IndOH]
The equations, derived from the acidity constant and basicity constant, states that when pH equals the pKa or pKb value of the indicator, both species are present in a 1:1 ratio. If pH is above the pKa or pKb value, the concentration of the conjugate base is greater than the concentration of the acid, and the color associated with the conjugate base dominates. If pH is below the pKa or pKb value, the converse is true.
Usually, the color change is not instantaneous at the pKa or pKb value, but a pH range exists where a mixture of colors is present. This pH range varies between indicators, but as a rule of thumb, it falls between the pKa or pKb value plus or minus one. This assumes that solutions retain their color as long as at least 10% of the other species persists. For example, if the concentration of the conjugate base is 10 times greater than the concentration of the acid, their ratio is 10:1, and consequently the pH is pKa + 1 or pKb + 1. Conversely, if a 10-fold excess of the acid occurs with respect to the base, the ratio is 1:10 and the pH is pKa − 1 or pKb − 1.
For optimal accuracy, the color difference between the two species should be as clear as possible, and the narrower the pH range of the color change the better. In some indicators, such as phenolphthalein, one of the species is colorless, whereas in other indicators, such as methyl red, both species confer a color. While pH indicators work efficiently at their designated pH range, they are usually destroyed at the extreme ends of the pH scale due to undesired side reactions.
Application[edit]

pH indicators are frequently employed in titrations in analytical chemistry and biology to determine the extent of a chemical reaction.[1] Because of the subjective choice (determination) of color, pH indicators are susceptible to imprecise readings. For applications requiring precise measurement of pH, a pH meter is frequently used. Sometimes, a blend of different indicators is used to achieve several smooth color changes over a wide range of pH values. These commercial indicators (e.g., universal indicator and Hydrion papers) are used when only rough knowledge of pH is necessary. For a titration, the difference between the true endpoint and the indicated endpoint is called the indicator error.[1]
Tabulated below are several common laboratory pH indicators. Indicators usually exhibit intermediate colors at pH values inside the listed transition range. For example, phenol red exhibits an orange color between pH 6.8 and pH 8.4. The transition range may shift slightly depending on the concentration of the indicator in the solution and on the temperature at which it is used. The figure on the right shows indicators with their operation range and color changes.
| Indicator | Low pH color | Transition low end |
Transition high end |
High pH color |
|---|---|---|---|---|
| Gentian violet (Methyl violet 10B)[4] | yellow | 0.0 | 2.0 | blue-violet |
| Malachite green (first transition) | yellow | 0.0 | 2.0 | green |
| Malachite green (second transition) | green | 11.6 | 14.0 | colorless |
| Thymol blue (first transition) | red | 1.2 | 2.8 | yellow |
| Thymol blue (second transition) | yellow | 8.0 | 9.6 | blue |
| Methyl yellow | red | 2.9 | 4.0 | yellow |
| Methylene blue | colorless | 5.0 | 9.0 | dark blue |
| Bromophenol blue | yellow | 3.0 | 4.6 | blue |
| Congo red | blue-violet | 3.0 | 5.0 | red |
| Methyl orange | red | 3.1 | 4.4 | yellow |
| Screened methyl orange (first transition) | red | 0.0 | 3.2 | purple-grey |
| Screened methyl orange (second transition) | purple-grey | 3.2 | 4.2 | green |
| Bromocresol green | yellow | 3.8 | 5.4 | blue |
| Methyl red | red | 4.4 | 6.2 | yellow |
| Methyl purple | purple | 4.8 | 5.4 | green |
| Azolitmin (litmus) | red | 4.5 | 8.3 | blue |
| Bromocresol purple | yellow | 5.2 | 6.8 | purple |
| Bromothymol blue | yellow | 6.0 | 7.6 | blue |
| Phenol red | yellow | 6.4 | 8.0 | red |
| Neutral red | red | 6.8 | 8.0 | yellow |
| Naphtholphthalein | pale red | 7.3 | 8.7 | greenish-blue |
| Cresol red | yellow | 7.2 | 8.8 | reddish-purple |
| Cresolphthalein | colorless | 8.2 | 9.8 | purple |
| Phenolphthalein (first transition) | colorless | 8.3 | 10.0 | purple-pink |
| Phenolphthalein (second transition) | purple-pink | 12.0 | 13.0 | colorless |
| Thymolphthalein | colorless | 9.3 | 10.5 | blue |
| Alizarine Yellow R | yellow | 10.2 | 12.0 | red |
| Indigo carmine | blue | 11.4 | 13.0 | yellow |
Universal Indicator[edit]
| pH range | Description | Colour |
|---|---|---|
| 1-3 | Strong acid | Red |
| 3 – 6 | Weak acid | Orange/Yellow |
| 7 | Neutral | Green |
| 8 – 11 | Weak alkali | Blue |
| 11-14 | Strong alkali | Violet/Indigo |
Precise pH measurement[edit]

An indicator may be used to obtain quite precise measurements of pH by measuring absorbance quantitatively at two or more wavelengths. The principle can be illustrated by taking the indicator to be a simple acid, HA, which dissociates into H+ and A−.
- HA ⇌ H+ + A−
The value of the acid dissociation constant, pKa, must be known. The molar absorbances, εHA and εA− of the two species HA and A− at wavelengths λx and λy must also have been determined by previous experiment. Assuming Beer's law to be obeyed, the measured absorbances Ax and Ay at the two wavelengths are simply the sum of the absorbances due to each species.
![{\displaystyle {\begin{aligned}A_{x}&=[{\ce {HA}}]\varepsilon _{{\ce {HA}}}^{x}+[{\ce {A-}}]\varepsilon _{{\ce {A-}}}^{x}\\A_{y}&=[{\ce {HA}}]\varepsilon _{{\ce {HA}}}^{y}+[{\ce {A-}}]\varepsilon _{{\ce {A-}}}^{y}\end{aligned}}}](https://wikimedia.org/api/rest_v1/media/math/render/svg/407bba3b954782cbec25c32d99393bf282c2c36d)
These are two equations in the two concentrations [HA] and [A−]. Once solved, the pH is obtained as
![{\displaystyle \mathrm {pH} =\mathrm {p} K_{\mathrm {a} }+\log {\frac {[{\ce {A-}}]}{[{\ce {HA}}]}}}](https://wikimedia.org/api/rest_v1/media/math/render/svg/2ed476e8f78a1980748a81ec195978b60032411f)
If measurements are made at more than two wavelengths, the concentrations [HA] and [A−] can be calculated by linear least squares. In fact, a whole spectrum may be used for this purpose. The process is illustrated for the indicator bromocresol green. The observed spectrum (green) is the sum of the spectra of HA (gold) and of A− (blue), weighted for the concentration of the two species.
When a single indicator is used, this method is limited to measurements in the pH range pKa ± 1, but this range can be extended by using mixtures of two or more indicators. Because indicators have intense absorption spectra, the indicator concentration is relatively low, and the indicator itself is assumed to have a negligible effect on pH.
Equivalence point[edit]
In acid-base titrations, an unfitting pH indicator may induce a color change in the indicator-containing solution before or after the actual equivalence point. As a result, different equivalence points for a solution can be concluded based on the pH indicator used. This is because the slightest color change of the indicator-containing solution suggests the equivalence point has been reached. Therefore, the most suitable pH indicator has an effective pH range, where the change in color is apparent, that encompasses the pH of the equivalence point of the solution being titrated.[5]
Naturally occurring pH indicators[edit]
Many plants or plant parts contain chemicals from the naturally colored anthocyanin family of compounds. They are red in acidic solutions and blue in basic. Anthocyanins can be extracted with water or other solvents from a multitude of colored plants and plant parts, including from leaves (red cabbage); flowers (geranium, poppy, or rose petals); berries (blueberries, blackcurrant); and stems (rhubarb). Extracting anthocyanins from household plants, especially red cabbage, to form a crude pH indicator is a popular introductory chemistry demonstration.
Litmus, used by alchemists in the Middle Ages and still readily available, is a naturally occurring pH indicator made from a mixture of lichen species, particularly Roccella tinctoria. The word litmus is literally from 'colored moss' in Old Norse (see Litr). The color changes between red in acid solutions and blue in alkalis. The term 'litmus test' has become a widely used metaphor for any test that purports to distinguish authoritatively between alternatives.
Hydrangea macrophylla flowers can change color depending on soil acidity. In acid soils, chemical reactions occur in the soil that make aluminium available to these plants, turning the flowers blue. In alkaline soils, these reactions cannot occur and therefore aluminium is not taken up by the plant. As a result, the flowers remain pink.
Another natural pH indicator is the spice turmeric. It turns yellow when exposed to acids and reddish brown when in presence of an alkalis.
| Indicator | Low pH color | High pH color |
|---|---|---|
| Hydrangea flowers | blue | pink to purple |
| Anthocyanins | red | blue |
| Litmus | red | blue |
| Turmeric | yellow | reddish brown |
-
 Hydrangea in acid soil
 -
 Hydrangea in alkaline soil
 -
 A gradient of red cabbage extract pH indicator from acidic solution on the left to basic on the right
 -
 Purple cauliflower soaked in baking soda (left) and vinegar (right). Anthocyanin acts as an pH indicator.
 -
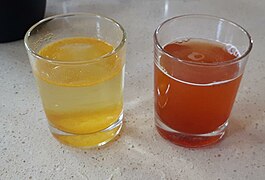 Turmeric dissolved in water is yellow under acidic and reddish brown under alkaline conditions


See also[edit]
References[edit]
- ^ a b c Harris, Daniel C. (2005). Exploring chemical analysis (3rd ed.). New York: W.H. Freeman. ISBN 0-7167-0571-0. OCLC 54073810.
- ^ Schwarzenbach, Gerold (1957). Complexometric Titrations. Translated by Irving, Harry (1st English ed.). London: Methuen & Co. pp. 29–46.
- ^ West, T. S. (1969). Complexometry with EDTA and related reagents (3rd ed.). Poole, UK: BDH Chemicals Ltd. pp. 14–82.
- ^ Adams, Elliot Q.; Rosenstein, Ludwig. (1914). "The Color and Ionization of Crystal-Violet". Journal of the American Chemical Society. 36 (7): 1452–1473. doi:10.1021/ja02184a014. hdl:2027/uc1.b3762873. ISSN 0002-7863.
- ^ Zumdahl, Steven S. (2009). Chemical Principles (6th ed.). New York: Houghton Mifflin Company. pp. 319–324.
External links[edit]
- Long indicator list, Archived 4 March 2022 at the Wayback Machine