U.S. House district for California
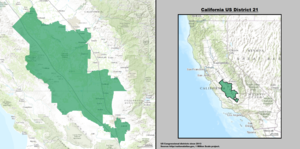
California's 21st congressional district Interactive map of district boundaries since 2023 (Used in the
2022 elections )
Representative Population (2022) 748,904 Median household $61,213[1] Ethnicity Cook PVI D+9[2]
California's 21st congressional district (or CA-21 ) is a congressional district in the U.S. state of California . It is located in the San Joaquin Valley and includes parts of Fresno County and Tulare County . Cities in the district include the majority of Fresno , the north side of Visalia , and all of Sanger , Selma , Kingsburg , Parlier , Reedley , Orange Cove , Dinuba , Orosi , Cutler , Farmersville , Woodlake and Exeter .[3] Democrat Jim Costa .
Demographics [ edit ] According to the APM Research Lab's Voter Profile Tools (featuring the U.S. Census Bureau's 2019 American Community Survey), the district contained about 377,000 potential voters (citizens, age 18+). Of these, 63% are Latino, while 26% are White. Immigrants make up 16% of the district's potential voters. Median income among households (with one or more potential voter) in the district is about $51,500, while 15% of households live below the poverty line. As for the educational attainment of potential voters in the district, 23% of those 25 and older have not earned a high school degree, while 12% hold a bachelor's or higher degree.
Election results from statewide races [ edit ] Composition [ edit ] Cities with 10,000 or more people [ edit ] Fresno - 542,107Visalia - 141,384Reedley - 25,658Sanger - 25,339Selma - 24,825Dinuba - 24,563Parlier - 18,494Kingsburg - 12,380Farmersville - 10,382Exeter - 10,324Orange Cove - 10,2732,500-10,000 people [ edit ] List of members representing the district [ edit ]
Representative
Party
Dates
Cong
Electoral history
Counties
District created January 3, 1943
Harry R. Sheppard (Yucaipa )
Democratic
January 3, 1943 –
78th 79th 80th 81st 82nd
Redistricted from the 19th district re-elected in 1942 .Re-elected in 1944 .Re-elected in 1946 .Re-elected in 1948 .Re-elected in 1950 .27th district
1943–1953 Los Angeles , San Bernardino
Edgar W. Hiestand (Burbank )
Republican
January 3, 1953 –
83rd 84th 85th 86th 87th
Elected in 1952 .Re-elected in 1954 .Re-elected in 1956 .Re-elected in 1958 .Re-elected in 1960 .27th district 1953–1983 Los Angeles
Augustus Hawkins (Los Angeles )
Democratic
January 3, 1963 –
88th 89th 90th 91st 92nd 93rd
Elected in 1962 .Re-elected in 1964 .Re-elected in 1966 .Re-elected in 1968 .Re-elected in 1970 .Re-elected in 1972 .29th district
James C. Corman (Los Angeles )
Democratic
January 3, 1975 –
94th 95th 96th
Redistricted from the 22nd district re-elected in 1974 .Re-elected in 1976 .Re-elected in 1978 .
Bobbi Fiedler (Los Angeles )
Republican
January 3, 1981 –
97th 98th 99th
Elected in 1980 .Re-elected in 1982 .Re-elected in 1984 .run for U.S. Senator .
1983–1993 Los Angeles (western San Fernando Valley ), southeastern Ventura
Elton Gallegly (Simi Valley )
Republican
January 3, 1987 –
100th 101st 102nd
Elected in 1986 .Re-elected in 1988 .Re-elected in 1990 .23rd district
Bill Thomas (Bakersfield )
Republican
January 3, 1993 –
103rd 104th 105th 106th 107th
Redistricted from the 20th district re-elected in 1992 .Re-elected in 1994 .Re-elected in 1996 .Re-elected in 1998 .Re-elected in 2000 .22nd district
1993–2003 Kern , eastern Tulare
Devin Nunes (Pixley )
Republican
January 3, 2003 –
108th 109th 110th 111th 112th
Elected in 2002 .Re-elected in 2004 .Re-elected in 2006 .Re-elected in 2008 .Re-elected in 2010 .22nd district 2003–2013 Fresno , Tulare
David Valadao (Hanford )
Republican
January 3, 2013 –
113th 114th 115th
Elected in 2012 .Re-elected in 2014 .Re-elected in 2016 .2013–2023 Kings , parts of Fresno , Kern and Tulare .
TJ Cox (Selma )
Democratic
January 3, 2019 –
116th
Elected in 2018 .
David Valadao (Hanford )
Republican
January 3, 2021–
117th
Elected in 2020 .22nd district
Jim Costa (Fresno )
Democratic
January 3, 2023 –
118th
Redistricted from the 16th district re-elected in 2022 .
2023–present San Joaquin Valley between Fresno and Visalia
Election results [ edit ] See also [ edit ]
References [ edit ]
^ "My Congressional District" .^ "2022 Cook PVI: District Map and List" . Cook Political Report . Retrieved January 10, 2023 .^ "CA 2022 Congressional" . Dave's Redistricting . January 4, 2022. Retrieved November 11, 2022 .^ "Counties by Congressional District for Recall Question" (PDF) . sos.ca.gov . September 14, 2021. Retrieved May 2, 2022 .^ "Counties by Congressional Districts for Governor" (PDF) . sos.ca.gov . November 8, 2022. Retrieved May 4, 2023 .^ 1942 election results ^ 1944 election results ^ 1946 election results ^ 1948 election results ^ 1950 election results ^ 1952 election results ^ 1954 election results ^ 1956 election results ^ 1958 election results ^ 1960 election results ^ 1962 election results ^ 1964 election results ^ 1966 election results ^ 1968 election results ^ 1970 election results ^ 1972 election results ^ 1974 election results ^ 1976 election results ^ 1978 election results ^ 1980 election results ^ 1982 election results ^ 1984 election results ^ 1986 election results ^ 1988 election results ^ 1990 election results ^ 1992 election results ^ 1994 election results ^ 1996 election results ^ 1998 election results ^ 2000 election results ^ 2002 general election results Archived February 3, 2009, at the Wayback Machine ^ 2004 general election results Archived 2008-08-21 at the Wayback Machine ^ 2006 general election results Archived November 27, 2008, at the Wayback Machine ^ California - Election Results 2008 - The New York Times ^ Barone, Michael ; Cohen, Richard E. (2009). Koszczuk, Jackie (ed.). The Almanac of American Politics Washington, D.C. : National Journal Group . p. 195 . ISBN 978-0-89234-120-7 .^ Statement of Vote November 4, 2008, General Election Archived October 18, 2012, at the Wayback Machine ^ 2010 general election results [permanent dead link ^ 2012 general election results Archived October 19, 2013, at the Wayback Machine ^
U.S. House of Representatives District 21 - Districtwide Results Archived 2014-12-14 at the Wayback Machine
^
U.S. House of Representatives District 21 - Districtwide Results Archived 2014-11-18 at the Wayback Machine
^
U.S. House of Representatives District 21 - Districtwide Results Archived 2018-12-02 at the Wayback Machine
External links [ edit ]
The at-large seats only existed from 1850 to 1865 and from 1883 to 1885. See also
California's past and present representatives , senators , and delegations
36°30′N 119°00′W / 36.5°N 119°W / 36.5; -119