Election in West Virginia
The 1972 United States presidential election in West Virginia took place on November 7, 1972, as part of the 1972 United States presidential election . West Virginia voters chose six[1] Electoral College , who voted for president and vice president .
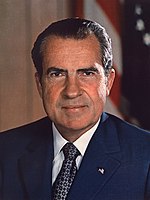
West Virginia was won by incumbent President Richard Nixon (R –California ), with 63.61 percent of the popular vote, against George McGovern (D –South Dakota ), with 36.39 percent of the popular vote.[2] [3] Logan County , which McGovern won by 2.62 percentage points.[4] Webster County , the first to carry Gilmer County and Randolph County since Ulysses S. Grant in 1868, and the first to carry Boone County and Braxton County since Warren G. Harding in 1920.[5] McDowell County .
In this socially conservative[6] [7] busing and civil rights, alongside fears that McGovern would legalize abortion and illicit drugs if elected[8]
Results [ edit ] Results by county [ edit ]
1972 United States presidential election in West Virginia by county[9]
County
Richard Milhous Nixon George Stanley McGovern Margin
Total votes cast
#
%
#
%
#
%
Barbour
4,432
66.25%
2,258
33.75%
2,174
32.50%
6,690
Berkeley
10,954
70.78%
4,523
29.22%
6,431
41.55%
15,477
Boone
5,985
52.84%
5,342
47.16%
643
5.68%
11,327
Braxton
3,155
53.24%
2,771
46.76%
384
6.48%
5,926
Brooke
7,544
59.08%
5,226
40.92%
2,318
18.15%
12,770
Cabell
29,582
67.39%
14,312
32.61%
15,270
34.79%
43,894
Calhoun
1,992
56.59%
1,528
43.41%
464
13.18%
3,520
Clay
2,186
54.23%
1,830
45.77%
338
8.45%
3,998
Doddridge
2,284
77.98%
645
22.02%
1,639
55.96%
2,929
Fayette
11,876
54.37%
9,966
45.63%
1,910
8.74%
21,842
Gilmer
2,056
60.20%
1,359
39.80%
697
20.41%
3,415
Grant
3,556
85.28%
614
14.72%
2,942
70.55%
4,170
Greenbrier
8,827
66.62%
4,423
33.38%
4,404
33.24%
13,250
Hampshire
3,084
65.33%
1,637
34.67%
1,447
30.65%
4,721
Hancock
10,634
61.25%
6,727
38.75%
3,907
22.50%
17,361
Hardy
2,609
63.34%
1,510
36.66%
1,099
26.68%
4,119
Harrison
22,196
63.23%
12,910
36.77%
9,286
26.45%
35,106
Jackson
7,226
70.61%
3,007
29.39%
4,219
41.23%
10,233
Jefferson
4,822
63.41%
2,782
36.59%
2,040
26.83%
7,604
Kanawha
65,021
63.09%
38,032
36.91%
26,989
26.19%
103,053
Lewis
5,778
73.70%
2,062
26.30%
3,716
47.40%
7,840
Lincoln
4,673
54.66%
3,876
45.34%
797
9.32%
8,549
Logan
9,533
48.69%
10,045
51.31%
-512
-2.62%
19,578
Marion
16,095
57.57%
11,864
42.43%
4,231
15.13%
27,959
Marshall
10,966
63.23%
6,378
36.77%
4,588
26.45%
17,344
Mason
7,129
64.01%
4,008
35.99%
3,121
28.02%
11,137
McDowell
8,942
56.76%
6,811
43.24%
2,131
13.53%
15,753
Mercer
17,846
69.52%
7,826
30.48%
10,020
39.03%
25,672
Mineral
7,157
68.60%
3,276
31.40%
3,881
37.20%
10,433
Mingo
7,484
57.27%
5,585
42.73%
1,899
14.53%
13,069
Monongalia
16,758
60.98%
10,721
39.02%
6,037
21.97%
27,479
Monroe
3,716
63.74%
2,114
36.26%
1,602
27.48%
5,830
Morgan
3,014
72.94%
1,118
27.06%
1,896
45.89%
4,132
Nicholas
5,907
61.95%
3,628
38.05%
2,279
23.90%
9,535
Ohio
18,435
63.73%
10,491
36.27%
7,944
27.46%
28,926
Pendleton
2,207
63.88%
1,248
36.12%
959
27.76%
3,455
Pleasants
2,025
62.65%
1,207
37.35%
818
25.31%
3,232
Pocahontas
2,391
59.39%
1,635
40.61%
756
18.78%
4,026
Preston
7,807
72.39%
2,977
27.61%
4,830
44.79%
10,784
Putnam
8,265
63.40%
4,771
36.60%
3,494
26.80%
13,036
Raleigh
19,150
64.40%
10,586
35.60%
8,564
28.80%
29,736
Randolph
6,923
64.51%
3,809
35.49%
3,114
29.02%
10,732
Ritchie
3,635
78.59%
990
21.41%
2,645
57.19%
4,625
Roane
4,253
64.06%
2,386
35.94%
1,867
28.12%
6,639
Summers
3,895
60.74%
2,518
39.26%
1,377
21.47%
6,413
Taylor
4,385
67.77%
2,085
32.23%
2,300
35.55%
6,470
Tucker
2,163
59.75%
1,457
40.25%
706
19.50%
3,620
Tyler
3,362
74.93%
1,125
25.07%
2,237
49.86%
4,487
Upshur
6,449
78.23%
1,795
21.77%
4,654
56.45%
8,244
Wayne
9,775
60.99%
6,251
39.01%
3,524
21.99%
16,026
Webster
2,114
50.54%
2,069
49.46%
45
1.08%
4,183
Wetzel
6,046
64.86%
3,276
35.14%
2,770
29.71%
9,322
Wirt
1,442
67.60%
691
32.40%
751
35.21%
2,133
Wood
27,315
71.50%
10,886
28.50%
16,429
43.01%
38,201
Wyoming
7,926
63.95%
4,468
36.05%
3,458
27.90%
12,394
Totals
484,964
63.61%
277,435
36.39%
207,529
27.22%
762,399
References [ edit ]
^ "1972 Election for the Forty-Seventh Term (1973-77)" . Retrieved February 22, 2017 .^ "1972 Presidential General Election Results — West Virginia" . Retrieved February 22, 2017 .^ "The American Presidency Project — Election of 1972" . Retrieved February 22, 2017 .^ "1972 Presidential Election Results in West Virginia by county" . Retrieved March 24, 2019 .^ Menendez, Albert J. The Geography of Presidential Elections in the United States, 1868-2004 . pp. 334–337. ISBN 0786422173 . ^ Cohn, Nate (April 24, 2014). "Demographic Shift: Southern Whites' Loyalty to G.O.P. Nearing That of Blacks to Democrats" . New York Times . ^ Phillips, Kevin P. The Emerging Republican Majority . pp. 10, 135, 288, 374. ISBN 978-0-691-16324-6 . ^ Davis, Lanny; Scandal: How "Gotcha" Politics Is Destroying America , pp. 65-66 ISBN 1466892803
^ "1972 General Election — Official Election Returns" (PDF) . West Virginia Board of Elections.


