Grafton County | |
|---|---|
 Grafton County Courthouse in Haverhill | |
 Location within the U.S. state of New Hampshire | |
 New Hampshire's location within the U.S. | |
| Coordinates: 43°53′46″N 71°53′41″W / 43.896069°N 71.89463°W | |
| Country | |
| State | |
| Founded | 1769 |
| Named for | Augustus FitzRoy, 3rd Duke of Grafton |
| Seat | Haverhill |
| Largest city | Lebanon |
| Area | |
| • Total | 1,749.7 sq mi (4,532 km2) |
| • Land | 1,708.6 sq mi (4,425 km2) |
| • Water | 41.1 sq mi (106 km2) 2.3% |
| Population (2020) | |
| • Total | 91,118 |
| • Estimate (2022) | 91,126 |
| • Density | 53.3/sq mi (20.6/km2) |
| Time zone | UTC−5 (Eastern) |
| • Summer (DST) | UTC−4 (EDT) |
| Congressional districts | 1st, 2nd |
| Website | www |
Grafton County is a county in the U.S. state of New Hampshire. As of the 2020 census, the population was 91,118.[1] Its county seat is the town of Haverhill.[2] In 1972, the county courthouse and other offices were moved from Woodsville, a larger village within the town of Haverhill, to North Haverhill.
Grafton County is part of the Claremont-Lebanon, NH–VT Micropolitan Statistical Area.
The county is the home of Dartmouth College and Plymouth State University. Progressive Farmer rated Grafton County fourth in its list of the "Best Places to Live in Rural America" in 2006,[3] citing low unemployment (despite slow economic growth), a favorable cost of living, and the presence of White Mountain National Forest, the state's only national forest.
History[edit]
Grafton was one of the five counties originally identified for New Hampshire in 1769. It was named for Augustus FitzRoy, 3rd Duke of Grafton,[4] who had been a supporter of American causes in Parliament, and who was serving as British Prime Minister at the time. The county was organized at Haverhill in 1771, and originally included the entire northern frontier of New Hampshire, including several towns now in Vermont. In 1803, the northern area was removed for the formation of Coos County. The three counties to the south were Strafford, Hillsborough and Cheshire, and the eastern edge bordered the "District of Maine". In 1797, the county had 50 townships, 17 locations, and a population of 23,093.[5]
Geography[edit]
According to the United States Census Bureau, the county has a total area of 1,750 square miles (4,500 km2), of which 1,709 square miles (4,430 km2) are land and 41 square miles (110 km2) (2.3%) are water.[6] It is the second-largest county in New Hampshire by area.
Grafton County is heavily rural. About half of its area is in the White Mountain National Forest. Squam Lake, featured in the film On Golden Pond, and the Old Man of the Mountain landmark are here, as are Dartmouth College and the Hubbard Brook Experimental Forest. Many of the 4,000-foot mountains of New Hampshire are within the county. The Appalachian Trail passes through parts of at least ten towns in the county.
Adjacent counties[edit]
- Essex County, Vermont (north)
- Coos County (northeast)
- Carroll County (east)
- Belknap County (southeast)
- Merrimack County (south)
- Sullivan County (south)
- Windsor County, Vermont (southwest)
- Orange County, Vermont (west)
- Caledonia County, Vermont (northwest)
National protected area[edit]
Demographics[edit]
| Census | Pop. | Note | %± |
|---|---|---|---|
| 1790 | 13,468 | — | |
| 1800 | 23,093 | 71.5% | |
| 1810 | 28,462 | 23.2% | |
| 1820 | 32,989 | 15.9% | |
| 1830 | 38,682 | 17.3% | |
| 1840 | 42,311 | 9.4% | |
| 1850 | 42,343 | 0.1% | |
| 1860 | 42,260 | −0.2% | |
| 1870 | 39,103 | −7.5% | |
| 1880 | 38,788 | −0.8% | |
| 1890 | 37,217 | −4.1% | |
| 1900 | 40,844 | 9.7% | |
| 1910 | 41,652 | 2.0% | |
| 1920 | 40,572 | −2.6% | |
| 1930 | 42,816 | 5.5% | |
| 1940 | 44,645 | 4.3% | |
| 1950 | 47,923 | 7.3% | |
| 1960 | 48,857 | 1.9% | |
| 1970 | 54,914 | 12.4% | |
| 1980 | 65,806 | 19.8% | |
| 1990 | 74,929 | 13.9% | |
| 2000 | 81,743 | 9.1% | |
| 2010 | 89,118 | 9.0% | |
| 2020 | 91,118 | 2.2% | |
| 2022 (est.) | 91,126 | [7] | 0.0% |
| U.S. Decennial Census[8] 1790-1960[9] 1900-1990[10] 1990-2000[11] 2010-2018[1] | |||
2000 census[edit]
As of the census[12] of 2000, 81,743 people, 31,598 households, and 20,254 families resided in the county. The population density was 48 inhabitants per square mile (19 inhabitants/km2). There were 43,729 housing units at an average density of 26 units per square mile (10/km2). The county's racial makeup was 95.76% White, 1.73% Asian, 0.53% Black or African American, 0.31% Native American, 0.03% Pacific Islander, 0.39% from other races, and 1.26% from two or more races. 1.12% of the population were Hispanic or Latino of any race. 19.0% were of English, 12.9% Irish, 11.1% French, 7.8% American, 7.5% German, 6.8% French Canadian and 5.5% Italian ancestry. 95.1% spoke English, 1.5% French and 1.3% Spanish as their first language.
There were 31,598 households, of which 29.50% had children under the age of 18 living with them, 52.40% were married couples living together, 8.30% had a female householder with no husband present, and 35.90% were non-families. 27.40% of all households were made up of individuals, and 9.50% had someone living alone who was 65 years of age or older. The average household size was 2.38 and the average family size was 2.90.
In the county, the population was spread out, with 21.90% under the age of 18, 13.50% from 18 to 24, 27.00% from 25 to 44, 24.20% from 45 to 64, and 13.40% who were 65 years of age or older. The median age was 37 years. For every 100 females, there were 96.70 males. For every 100 females age 18 and over, there were 94.30 males.
The county's median household income was $41,962, and the median family income was $50,424. Males had a median income of $31,874 versus $25,286 for females. The per capita income for the county was $22,227. About 5.10% of families and 8.60% of the population were below the poverty line, including 8.60% of those under age 18 and 7.50% of those age 65 or over.
2010 census[edit]
As of the 2010 United States census, there were 89,118 people, 35,986 households, and 22,074 families in the county.[13] The population density was 52.2 inhabitants per square mile (20.2 inhabitants/km2). There were 51,120 housing units at an average density of 29.9 units per square mile (11.5 units/km2).[14] The county's racial makeup was 93.6% white, 3.0% Asian, 0.9% black or African American, 0.4% American Indian, 0.4% from other races, and 1.8% from two or more races. Those of Hispanic or Latino origin made up 1.8% of the population.[13] In terms of ancestry, 23.6% were English, 18.7% were Irish, 10.9% were German, 6.6% were Italian, 5.8% were Scottish, 5.8% were French Canadian, and 5.0% were American.[15]
Of the 35,986 households, 25.8% had children under the age of 18 living with them, 49.0% were married couples living together, 8.4% had a female householder with no husband present, 38.7% were non-families, and 29.4% of all households were made up of individuals. The average household size was 2.28 and the average family size was 2.80. The median age was 41.2 years.[13]
The median household income was $53,075 and the median family income was $66,253. Males had a median income of $43,566 versus $33,535 for females. The per capita income for the county was $28,170. About 5.1% of families and 9.8% of the population were below the poverty line, including 9.8% of those under age 18 and 10.6% of those age 65 or over.[16]
Politics and government[edit]
In the 2000 United States presidential election, Al Gore narrowly carried the county over George W. Bush, taking 47.31% of the vote to Bush's 46.71%. Other candidates got a combined 5.98%. In 2004 John Kerry prevailed over Bush by a wider margin: Kerry received 55.74% of the vote, while Bush received 43.17%. In 2008, Barack Obama carried Grafton by a landslide, receiving 63.03% of the vote to John McCain's 35.45%. It was Obama's highest percentage by county in New Hampshire.[17] In 2016, Hillary Clinton won this county with 55.7%, while Donald Trump received 37.1% of the vote. It was Clinton's highest percentage by county in New Hampshire.[18] In 2024, the county was the only one in the state to vote for Nikki Haley rather than Donald Trump in the state's Republican presidential primary.[citation needed]
| Year | Republican | Democratic | Third party | |||
|---|---|---|---|---|---|---|
| No. | % | No. | % | No. | % | |
| 2020 | 19,905 | 36.77% | 33,180 | 61.29% | 1,047 | 1.93% |
| 2016 | 19,010 | 37.14% | 28,510 | 55.69% | 3,671 | 7.17% |
| 2012 | 18,208 | 37.15% | 29,826 | 60.85% | 980 | 2.00% |
| 2008 | 17,687 | 35.45% | 31,446 | 63.03% | 757 | 1.52% |
| 2004 | 20,277 | 43.17% | 26,180 | 55.74% | 514 | 1.09% |
| 2000 | 18,092 | 46.71% | 18,326 | 47.31% | 2,315 | 5.98% |
| 1996 | 13,543 | 38.95% | 17,476 | 50.26% | 3,753 | 10.79% |
| 1992 | 13,450 | 37.01% | 15,389 | 42.34% | 7,504 | 20.65% |
| 1988 | 19,033 | 62.00% | 11,484 | 37.41% | 182 | 0.59% |
| 1984 | 18,451 | 67.59% | 8,757 | 32.08% | 92 | 0.34% |
| 1980 | 15,273 | 56.25% | 7,282 | 26.82% | 4,596 | 16.93% |
| 1976 | 14,430 | 60.34% | 8,996 | 37.62% | 488 | 2.04% |
| 1972 | 16,605 | 65.58% | 8,388 | 33.13% | 326 | 1.29% |
| 1968 | 12,881 | 59.76% | 7,813 | 36.25% | 860 | 3.99% |
| 1964 | 8,461 | 40.24% | 12,566 | 59.76% | 0 | 0.00% |
| 1960 | 14,454 | 64.89% | 7,821 | 35.11% | 0 | 0.00% |
| 1956 | 15,609 | 74.04% | 5,466 | 25.93% | 6 | 0.03% |
| 1952 | 15,937 | 72.24% | 6,124 | 27.76% | 0 | 0.00% |
| 1948 | 12,248 | 63.52% | 6,841 | 35.48% | 192 | 1.00% |
| 1944 | 10,947 | 55.58% | 8,743 | 44.39% | 7 | 0.04% |
| 1940 | 11,478 | 54.04% | 9,761 | 45.96% | 0 | 0.00% |
| 1936 | 11,336 | 56.63% | 8,520 | 42.57% | 160 | 0.80% |
| 1932 | 10,810 | 55.94% | 8,342 | 43.17% | 171 | 0.88% |
| 1928 | 12,566 | 66.99% | 6,035 | 32.17% | 158 | 0.84% |
| 1924 | 10,493 | 64.12% | 5,360 | 32.75% | 511 | 3.12% |
| 1920 | 9,650 | 61.10% | 6,102 | 38.63% | 42 | 0.27% |
| 1916 | 4,795 | 50.38% | 4,644 | 48.80% | 78 | 0.82% |
| 1912 | 3,520 | 36.70% | 3,752 | 39.12% | 2,318 | 24.17% |
| 1908 | 6,323 | 62.60% | 3,582 | 35.46% | 196 | 1.94% |
| 1904 | 6,100 | 62.55% | 3,496 | 35.85% | 156 | 1.60% |
| 1900 | 6,177 | 61.71% | 3,619 | 36.15% | 214 | 2.14% |
| 1896 | 6,199 | 68.15% | 2,306 | 25.35% | 591 | 6.50% |
| 1892 | 4,828 | 49.25% | 4,794 | 48.90% | 182 | 1.86% |
| 1888 | 5,209 | 49.28% | 5,170 | 48.91% | 191 | 1.81% |
| 1884 | 5,171 | 50.30% | 4,917 | 47.83% | 193 | 1.88% |
| 1880 | 4,964 | 47.71% | 5,300 | 50.94% | 140 | 1.35% |
| 1876 | 4,763 | 48.33% | 5,092 | 51.66% | 1 | 0.01% |
County Commission[edit]
The executive power of Grafton County's government is held by three county commissioners, each representing one of the three commissioner districts within the county.
| District | Commissioner | Hometown | Party |
|---|---|---|---|
| 1 | Wendy Piper | Enfield | Democratic |
| 2 | Martha Stroup McLeod | Franconia | Democratic |
| 3 | Omer Ahern Jr. | Wentworth | Republican |
In addition to the County Commission, there are also five directly elected officials: they include County Attorney, Register of Deeds, County Sheriff, Register of Probate, and County Treasurer.
| Office | Name |
|---|---|
| County Attorney | Martha Ann Hornick (D) |
| Register of Deeds | Kelley Monahan (D) |
| County Sheriff | Jeff Stiegler (D) |
| Register of Probate | Charles Townsend (D) |
| County Treasurer | Karen Liot Hill (D) |
General court[edit]
The general court delegation of Grafton County is made up of all of the members of the New Hampshire House of Representatives from the county. There are 26 members from 18 different districts. After the 2022 elections, the party distribution of representatives was as follows.
| Affiliation | Members | Voting share | |
|---|---|---|---|
| Democratic Party | 18 | 69.2% | |
| Republican Party | 8 | 30.8% | |
| Total | 27 | 100% | |
Media[edit]
- WPNH - 1300 AM, Plymouth
- WTSL - 1400 AM, Hanover - News/Talk
- WLTN - 1400 AM, Littleton - Oldies - "Oldies 1400"
- WUVR - 1490 AM, Hanover - Talk
- W217BH - 91.3 FM, Littleton - New Hampshire Public Radio - Simulcast of WEVO in Concord, New Hampshire
- WEVH - 91.3 FM, Hanover - New Hampshire Public Radio
- WPCR - 91.7 FM, Plymouth - Plymouth State University
- WGXL - 92.3 FM, Hanover - Hot Adult Contemporary - "The Valley's Hit Music"
- W231BW - 94.1 FM, Littleton - Classic rock - "The Outlaw" - Simulcast of WOTX in Groveton
- W237CR - 95.3 FM, Littleton - Eclectic Music Mix (Hot AC/Rock/Dance) - "Kiss 102.3" - Simulcast of WXXS in Lancaster
- W240AK - 95.9 FM, Lebanon - Religious - "Alive Radio" - Simulcast of WBAR in Lake Luzerne, New York
- WLTN-FM - 96.7 FM, Lisbon - 1970s-1990s Adult Contemporary - "Mix 96.7"
- W245AF - 96.9 FM, Ashland - "New Hampshire Gospel Radio" - Simulcast of WVNH in Concord, New Hampshire
- W247AO - 97.3 FM, Plymouth - New Hampshire Public Radio - Simulcast of WEVO in Concord, New Hampshire
- W249AW - 97.7 FM, Lebanon - Religious - "Alive Radio" - Simulcast of WBAR in Lake Luzerne, New York
- WFRD - 99.3 FM, Hanover - Active Rock - "99 Rock"
- WPNH - 100.1 FM, Plymouth - "The Planet"
- WXXK - 100.5 FM, Lebanon - Country - "Kixx Country"
- WYKR-FM - 101.3 FM, Haverhill - Country
- W272AU - 102.3 FM, Hanover - Classic rock - "Champ 101.3 & 102.1" - Simulcast of WVXR in Randolph, Vermont
- W280CS - 103.9 FM, Hanover - Vermont Public Radio Classical Channel - Simulcast of WVPR in Burlington, Vermont
- WLKC - 105.7 FM, Campton - "The River" - Simulcast of WXRV in Andover, Massachusetts
- WMTK - 106.3 FM, Littleton - Classic rock - "The Notch"
- W294AB - 106.7 FM, Hanover - Classic rock - "Q106" - Simulcast of WHDQ in Claremont, New Hampshire
- W299AM - 107.7 FM, Lebanon - Christian contemporary - "K-Love" - Simulcast of WZKC in Royalton, Vermont
(Compiled from Radiostationworld.com)
Communities[edit]
City[edit]
Towns[edit]
- Alexandria
- Ashland
- Bath
- Benton
- Bethlehem
- Bridgewater
- Bristol
- Campton
- Canaan
- Dorchester
- Easton
- Ellsworth
- Enfield
- Franconia
- Grafton
- Groton
- Hanover
- Haverhill (county seat)
- Hebron
- Holderness
- Landaff
- Lincoln
- Lisbon
- Littleton
- Lyman
- Lyme
- Monroe
- Orange
- Orford
- Piermont
- Plymouth
- Rumney
- Sugar Hill
- Thornton
- Warren
- Waterville Valley
- Wentworth
- Woodstock
Township[edit]
Census-designated places[edit]
Villages[edit]
See also[edit]
References[edit]
- ^ a b "State & County QuickFacts". United States Census Bureau. Retrieved January 14, 2024.
- ^ "Find a County". National Association of Counties. Archived from the original on May 31, 2011. Retrieved June 7, 2011.
- ^ "Progressive Farmer's top counties for country living - Feb. 2, 2006". money.cnn.com. Retrieved June 5, 2020.
- ^ Gannett, Henry (1905). The Origin of Certain Place Names in the United States. Govt. Print. Off. p. 140.
- ^ Morse, Jedidiah: "The American Gazetteer", Thomas & Andrews, 1810
- ^ "2010 Census Gazetteer Files". United States Census Bureau. August 22, 2012. Archived from the original on December 27, 2014. Retrieved December 27, 2014.
- ^ "Annual Estimates of the Resident Population for Counties: April 1, 2020 to July 1, 2022". Retrieved January 14, 2024.
- ^ "U.S. Decennial Census". United States Census Bureau. Retrieved December 27, 2014.
- ^ "Historical Census Browser". University of Virginia Library. Retrieved December 27, 2014.
- ^ "Population of Counties by Decennial Census: 1900 to 1990". United States Census Bureau. Retrieved December 27, 2014.
- ^ "Census 2000 PHC-T-4. Ranking Tables for Counties: 1990 and 2000" (PDF). United States Census Bureau. Archived (PDF) from the original on March 27, 2010. Retrieved December 27, 2014.
- ^ "U.S. Census website". United States Census Bureau. Retrieved January 31, 2008.
- ^ a b c "DP-1 Profile of General Population and Housing Characteristics: 2010 Demographic Profile Data". United States Census Bureau. Archived from the original on February 13, 2020. Retrieved January 12, 2016.
- ^ "Population, Housing Units, Area, and Density: 2010 - County". United States Census Bureau. Archived from the original on February 13, 2020. Retrieved January 12, 2016.
- ^ "DP02 SELECTED SOCIAL CHARACTERISTICS IN THE UNITED STATES – 2006-2010 American Community Survey 5-Year Estimates". United States Census Bureau. Archived from the original on February 13, 2020. Retrieved January 12, 2016.
- ^ "DP03 SELECTED ECONOMIC CHARACTERISTICS – 2006-2010 American Community Survey 5-Year Estimates". United States Census Bureau. Archived from the original on February 13, 2020. Retrieved January 12, 2016.
- ^ Leip, David. "Dave Leip's Atlas of U.S. Presidential Elections". www.uselectionatlas.org. Retrieved April 4, 2018.
- ^ "Website Maintenance | Department of Information Technology".
- ^ Leip, David. "Dave Leip's Atlas of U.S. Presidential Elections". uselectionatlas.org. Retrieved April 4, 2018.
- ^ "General Election Winners - 11/03/2020" (PDF). New Hampshire Secretary of State's Office. November 11, 2020. Archived (PDF) from the original on May 25, 2021. Retrieved December 8, 2020.
External links[edit]
- Grafton County official website
- Grafton County profile, from University of New Hampshire Cooperative Extension website
- Grafton County Economic Development Council
- National Register of Historic places of Grafton County
Places adjacent to Grafton County, New Hampshire | ||||||||||||||||
|---|---|---|---|---|---|---|---|---|---|---|---|---|---|---|---|---|
| ||||||||||||||||
Municipalities and communities of Grafton County, New Hampshire, United States | ||
|---|---|---|
| City | 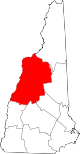 | |
| Towns |
| |
| Township | ||
| CDPs | ||
| Other villages | ||
| International | |
|---|---|
| National | |
| Geographic | |