| Member
|
Party
|
Years
|
Cong
ress
|
Electoral history
|
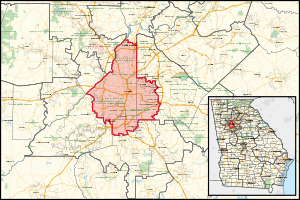
District map
|
| District created March 4, 1827
|
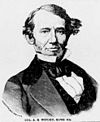
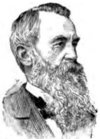
Charles Eaton Haynes
(Sparta)
|
Jacksonian
|
March 4, 1827 –
March 3, 1829
|
20th
|
Redistricted from the at-large district and re-elected in 1826.
Redistricted to the at-large district.
|
| District inactive
|
March 4, 1829 –
March 3, 1845
|
|

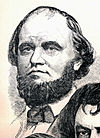
John Henry Lumpkin
(Rome)
|
Democratic
|
March 4, 1845 –
March 3, 1849
|
29th
30th
|
Elected in 1844.
Re-elected in 1846.
[data missing]
|
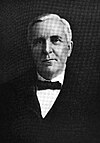
Thomas C. Hackett
(Rome)
|
Democratic
|
March 4, 1849 –
March 3, 1851
|
31st
|
Elected in 1848.
[data missing]
|
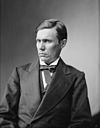
Elijah Webb Chastain
(Toccoa)
|
Unionist
|
March 4, 1851 –
March 3, 1853
|
32nd
33rd
|
Elected in 1851.
Re-elected in 1853.
[data missing]
|
| Democratic
|
March 4, 1853 –
March 3, 1855
|
John Henry Lumpkin
(Rome)
|
Democratic
|
March 4, 1855 –
March 3, 1857
|
34th
|
Elected in 1855.
[data missing]
|
Augustus R. Wright
(Rome)
|
Democratic
|
March 4, 1857 –
March 3, 1859
|
35th
|
Elected in 1857.
[data missing]
|
John William
Henderson Underwood
(Rome)
|
Democratic
|
March 4, 1859 –
January 23, 1861
|
36th
|
Elected in 1859.
Withdrew.
|
| Vacant
|
January 23, 1861 –
July 25, 1868
|
36th
37th
38th
39th
40th
|
Civil War and Reconstruction
|
Charles H. Prince
(Augusta)
|
Republican
|
July 25, 1868 –
March 3, 1869
|
40th
|
Elected to finish the term.
[data missing]
|
| Vacant
|
March 4, 1869 –
December 22, 1870
|
41st
|
|

Stephen A. Corker
(Waynesboro)
|
Democratic
|
December 22, 1870 –
March 3, 1871
|
Elected after the disqualification of Charles H. Prince.
[data missing]
|

Dudley M. DuBose
(Washington)
|
Democratic
|
March 4, 1871 –
March 3, 1873
|
42nd
|
Elected in 1870.
[data missing]
|

James C. Freeman
(Griffin)
|
Republican
|
March 4, 1873 –
March 3, 1875
|
43rd
|
Elected in 1872.
[data missing]
|
Milton A. Candler
(Atlanta)
|
Democratic
|
March 4, 1875 –
March 3, 1879
|
44th
45th
|
Elected in 1874.
Re-elected in 1876.
[data missing]
|
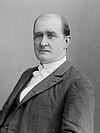
Nathaniel J. Hammond
(Atlanta)
|
Democratic
|
March 4, 1879 –
March 3, 1887
|
46th
47th
48th
49th
|
Elected in 1878.
Re-elected in 1880.
Re-elected in 1882.
Re-elected in 1884.
[data missing]
|
John D. Stewart
(Griffin)
|
Democratic
|
March 4, 1887 –
March 3, 1891
|
50th
51st
|
Elected in 1886.
Re-elected in 1888.
[data missing]
|
Leonidas F. Livingston
(Covington)
|
Democratic
|
March 4, 1891 –
March 3, 1911
|
52nd
53rd
54th
55th
56th
57th
58th
59th
60th
61st
|
Elected in 1890.
Re-elected in 1892.
Re-elected in 1894.
Re-elected in 1896.
Re-elected in 1898.
Re-elected in 1900.
Re-elected in 1902.
Re-elected in 1904.
Re-elected in 1906.
Re-elected in 1908.
[data missing]
|
William S. Howard
(Kirkwood)
|
Democratic
|
March 4, 1911 –
March 3, 1919
|
62nd
63rd
64th
65th
|
Elected in 1910.
Re-elected in 1912.
Re-elected in 1914.
Re-elected in 1916.
[data missing]
|

William David Upshaw
(Atlanta)
|
Democratic
|
March 4, 1919 –
March 3, 1927
|
66th
67th
68th
69th
|
Elected in 1918.
Re-elected in 1920.
Re-elected in 1922.
Re-elected in 1924.
Lost renomination.
|
Leslie Jasper Steele
(Decatur)
|
Democratic
|
March 4, 1927 –
July 24, 1929
|
70th
71st
|
Elected in 1926.
Re-elected in 1928.
Died.
|
| Vacant
|
July 14, 1929 –
October 2, 1929
|
71st
|
|
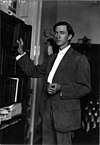
Robert Ramspeck
(Atlanta)
|
Democratic
|
October 2, 1929 –
December 31, 1945
|
71st
72nd
73rd
74th
75th
76th
77th
78th
79th
|
Elected to finish Steele's term.
Re-elected in 1930.
Re-elected in 1932.
Re-elected in 1934.
Re-elected in 1936.
Re-elected in 1938.
Re-elected in 1940.
Re-elected in 1942.
Re-elected in 1944.
Resigned to return to working in the aviation industry.
|
| Vacant
|
December 31, 1945 –
February 12, 1946
|
79th
|
|
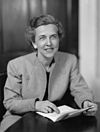
Helen Douglas Mankin
(Atlanta)
|
Democratic
|
February 12, 1946 –
January 3, 1947
|
Elected to finish Ramspeck's term.
Lost renomination, and then lost re-election as a write-in candidate.
|
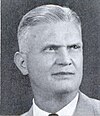
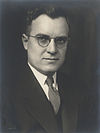
James C. Davis
(Stone Mountain)
|
Democratic
|
January 3, 1947 –
January 3, 1963
|
80th
81st
82nd
83rd
84th
85th
86th
87th
|
Elected in 1946.
Re-elected in 1948.
Re-elected in 1950.
Re-elected in 1952.
Re-elected in 1954.
Re-elected in 1956.
Re-elected in 1958.
Re-elected in 1960.
Lost renomination.
|
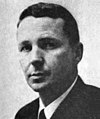
Charles L. Weltner
(Atlanta)
|
Democratic
|
January 3, 1963 –
January 3, 1967
|
88th
89th
|
Elected in 1962.
Re-elected in 1964.
Retired after refusing to endorse Lester Maddox for Governor of Georgia.
|
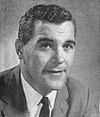
Fletcher Thompson
(East Point)
|
Republican
|
January 3, 1967 –
January 3, 1973
|
90th
91st
92nd
|
Elected in 1966.
Re-elected in 1968.
Re-elected in 1970.
Retired to run for U.S. senator.
|
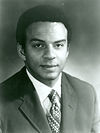
Andrew Young
(Atlanta)
|
Democratic
|
January 3, 1973 –
January 29, 1977
|
93rd
94th
95th
|
Elected in 1972.
Re-elected in 1974.
Re-elected in 1976.
Resigned to become U.S. Ambassador to the United Nations.
|
| Vacant
|
January 29, 1977 –
April 6, 1977
|
95th
|
|

Wyche Fowler
(Atlanta)
|
Democratic
|
April 6, 1977 –
January 3, 1987
|
95th
96th
97th
98th
99th
|
Elected to finish Young's term.
Re-elected in 1978.
Re-elected in 1980.
Re-elected in 1982.
Re-elected in 1984.
Retired to run for U.S. senator.
|

John Lewis
(Atlanta)
|
Democratic
|
January 3, 1987 –
July 17, 2020
|
100th
101st
102nd
103rd
104th
105th
106th
107th
108th
109th
110th
111th
112th
113th
114th
115th
116th
|
Elected in 1986.
Re-elected in 1988.
Re-elected in 1990.
Re-elected in 1992.
Re-elected in 1994.
Re-elected in 1996.
Re-elected in 1998.
Re-elected in 2000.
Re-elected in 2002.
Re-elected in 2004.
Re-elected in 2006.
Re-elected in 2008.
Re-elected in 2010.
Re-elected in 2012.
Re-elected in 2014.
Re-elected in 2016.
Re-elected in 2018.
Died.
|
|
2003–2007

|
2007–2013

|
2013–2023

|
| Vacant
|
July 17, 2020 –
December 3, 2020
|
116th
|
|

Kwanza Hall
(Atlanta)
|
Democratic
|
December 3, 2020 –
January 3, 2021
|
Elected to finish Lewis's term.
Was not a candidate for the next term.
|
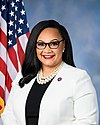
Nikema Williams
(Atlanta)
|
Democratic
|
January 3, 2021 –
present
|
117th
118th
|
Elected in 2020.
Re-elected in 2022.
|
2023–2025
|


