Dutch Island, Georgia | |
|---|---|
 Dutch Island | |
| Coordinates: 32°0′21″N 81°1′52″W / 32.00583°N 81.03111°W | |
| Country | United States |
| State | Georgia |
| County | Chatham |
| Area | |
| • Total | 3.06 sq mi (7.92 km2) |
| • Land | 2.46 sq mi (6.37 km2) |
| • Water | 0.60 sq mi (1.55 km2) |
| Elevation | 10 ft (3 m) |
| Population (2020) | |
| • Total | 1,238 |
| • Density | 503.25/sq mi (194.27/km2) |
| Time zone | UTC-5 (Eastern (EST)) |
| • Summer (DST) | UTC-4 (EDT) |
| FIPS code | 13-24876[3] |
| GNIS feature ID | 0313744[2] |
Dutch Island is an unincorporated community and census-designated place (CDP) in Chatham County, Georgia, United States. It is part of the Savannah Metropolitan Statistical Area, and at the 2020 census, its population was 1,238.[4]
Geography[edit]
Dutch Island is located southeast of Savannah at 32°0′21″N 81°1′52″W / 32.00583°N 81.03111°W.[5] It corresponds to the physical Dutch Island, a body of land surrounded by tidal channels: the Herb River to the northwest, the Wilmington River to the northeast, the Skidaway River to the southeast, and Grimball Creek to the southwest. The Wilmington and Skidaway rivers form part of the Atlantic Intracoastal Waterway. Dutch Island is connected by road to Isle of Hope to the southwest. By the road it is 14 miles (23 km) to downtown Savannah, though the straight-line distance is much less.
According to the United States Census Bureau, the Dutch Island CDP has a total area of 3.1 square miles (7.9 km2), of which 2.5 square miles (6.4 km2) is land and 0.58 square miles (1.5 km2), or 19.56%, is water.[4]
Demographics[edit]
| Census | Pop. | Note | %± |
|---|---|---|---|
| 2010 | 1,257 | — | |
| 2020 | 1,238 | −1.5% | |
| U.S. Decennial Census[6] 2010[7] 2020[8] | |||
Dutch Island was first listed as a census designated place in the 2010 U.S. Census. In 2020, its population was 1,238.
| Race / Ethnicity | Pop 2010[7] | Pop 2020[8] | % 2010 | % 2020 |
|---|---|---|---|---|
| White alone (NH) | 1,166 | 1,238 | 92.76% | 90.47% |
| Black or African American alone (NH) | 35 | 31 | 2.78% | 2.50% |
| Native American or Alaska Native alone (NH) | 0 | 0 | 0.00% | 0.00% |
| Asian alone (NH) | 22 | 22 | 1.75% | 1.78% |
| Pacific Islander alone (NH) | 0 | 0 | 0.00% | 0.00% |
| Some Other Race alone (NH) | 0 | 2 | 0.00% | 0.16% |
| Mixed Race/Multi-Racial (NH) | 8 | 24 | 0.64% | 1.94% |
| Hispanic or Latino (any race) | 26 | 39 | 2.07% | 3.15% |
| Total | 1,247 | 1,238 | 100.00% | 100.00% |
References[edit]
- ^ "2020 U.S. Gazetteer Files". United States Census Bureau. Retrieved December 18, 2021.
- ^ a b U.S. Geological Survey Geographic Names Information System: Dutch Island, Georgia
- ^ "U.S. Census website". United States Census Bureau. Retrieved January 31, 2008.
- ^ a b "Geographic Identifiers: 2010 Demographic Profile Data (G001): Dutch Island CDP, Georgia". U.S. Census Bureau, American Factfinder. Archived from the original on February 12, 2020. Retrieved July 22, 2014.
- ^ "US Gazetteer files: 2010, 2000, and 1990". United States Census Bureau. February 12, 2011. Retrieved April 23, 2011.
- ^ "Census of Population and Housing". Census.gov. Retrieved June 4, 2016.
- ^ a b "P2 Hispanic or Latino, and Not Hispanic or Latino by Race – 2010: DEC Redistricting Data (PL 94-171) – Dutch Island CDP, Georgia". United States Census Bureau.
- ^ a b "P2 Hispanic or Latino, and Not Hispanic or Latino by Race - 2020: DEC Redistricting Data (PL 94-171) – Dutch Island CDP, Georgia". United States Census Bureau.
Municipalities and communities of Chatham County, Georgia, United States | ||
|---|---|---|
| Cities | 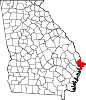 | |
| Towns | ||
| CDPs | ||
| Unincorporated communities | ||